Fig. 11
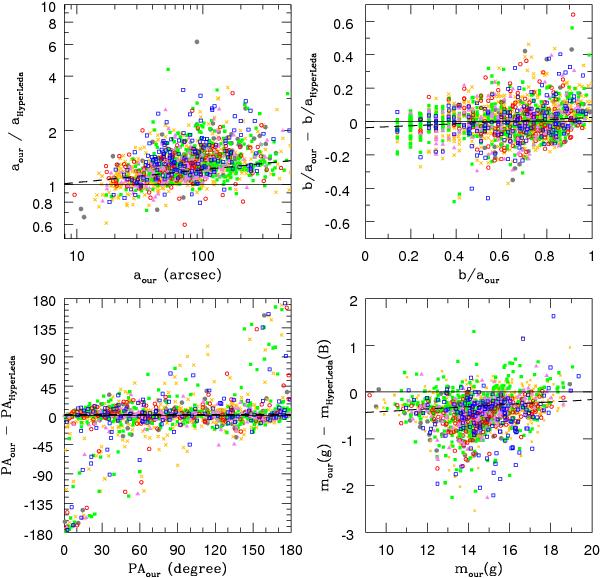
Top left: comparison between our measurements of major axes of E-Im galaxies and those of the HyperLeda in the B-band. Top right: comparison between measured axial ratios and those of the HyperLeda. Bottom left: comparison between our measurements of position angles and those of the HyperLeda. Bottom right: comparison between our measurements of apparent g-band magnitudes and that in the B-band of the HyperLeda. The color coding corresponds to Fig. 9: E-E/S0 (gray filled circles), S0-S0/a (red open circles), Sa-Sab (magenta triangles), Sb-Sbc (orange crosses), Sc-Scd (green filled squares), and Sd-Im (blue open squares). The solid lines in each figure are added to visually better illustrate the deviations. The dashed lines are best fit linear trends from Table 4.
Current usage metrics show cumulative count of Article Views (full-text article views including HTML views, PDF and ePub downloads, according to the available data) and Abstracts Views on Vision4Press platform.
Data correspond to usage on the plateform after 2015. The current usage metrics is available 48-96 hours after online publication and is updated daily on week days.
Initial download of the metrics may take a while.