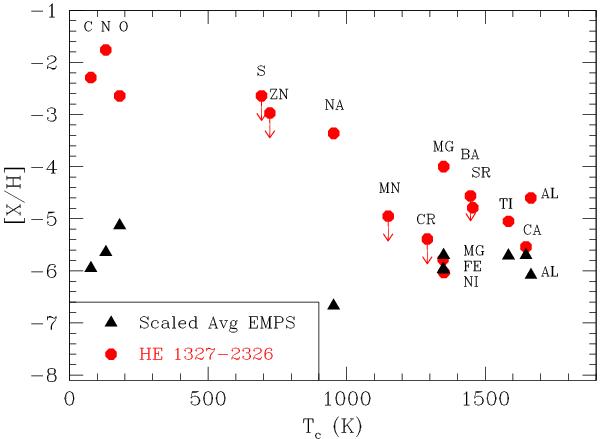
Fig. 2

Abundances in HE 1327-2326 (red circles) as a function of condensation temperature (Lodders 2003) compared to those of the “average star” (black triangles), as defined by Limongi & Chieffi (2012) starting from the data of Cayrel et al. (2004) and Spite et al. (2005). The symbols for Fe and Ni in the “average star” are on top of one another.
Current usage metrics show cumulative count of Article Views (full-text article views including HTML views, PDF and ePub downloads, according to the available data) and Abstracts Views on Vision4Press platform.
Data correspond to usage on the plateform after 2015. The current usage metrics is available 48-96 hours after online publication and is updated daily on week days.
Initial download of the metrics may take a while.


