Fig. 2
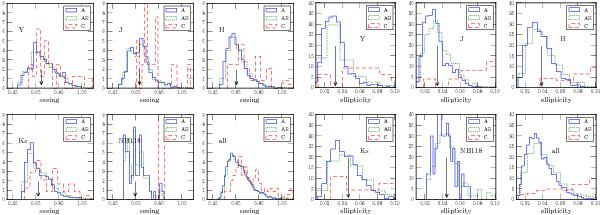
Seeing (left) and ellipticity (right) distributions for all UltraVISTA images considered. The arrow represents the median of each distribution for images classified as A or AB. Note that the distributions for each quality class have been re-normalised, and the vertical axis has been rescaled. A, AB, C represent the quality classifications described in the text.
Current usage metrics show cumulative count of Article Views (full-text article views including HTML views, PDF and ePub downloads, according to the available data) and Abstracts Views on Vision4Press platform.
Data correspond to usage on the plateform after 2015. The current usage metrics is available 48-96 hours after online publication and is updated daily on week days.
Initial download of the metrics may take a while.