Fig. 6
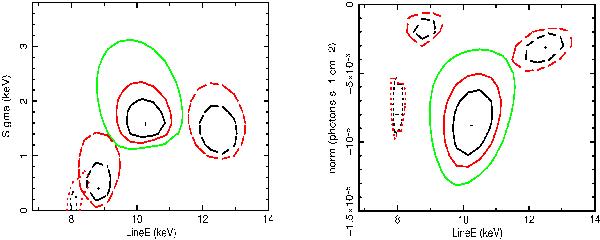
Left panel: 68, 90, 99% confidence contours of Eline vs. the line width from the APL+Gauss model fit of the Chandra 50 ks observation spectrum. The dashed (dotted) contours represent the 68 and 90% confidence contours of the parameters of the two lines in the 2007 stacked Chandra (2002 XMM-Newton) spectrum. Right panel: 68, 90, 99% confidence contours of Eline vs. normalization from the APL+Gauss model fit of the Chandra 50 ks observation spectrum. The dashed (dotted) contours represent the 68 and 90% confidence contours of the parameters of the two lines in the 2007 stacked Chandra (2002 XMM-Newton) spectrum.
Current usage metrics show cumulative count of Article Views (full-text article views including HTML views, PDF and ePub downloads, according to the available data) and Abstracts Views on Vision4Press platform.
Data correspond to usage on the plateform after 2015. The current usage metrics is available 48-96 hours after online publication and is updated daily on week days.
Initial download of the metrics may take a while.