Fig. 3
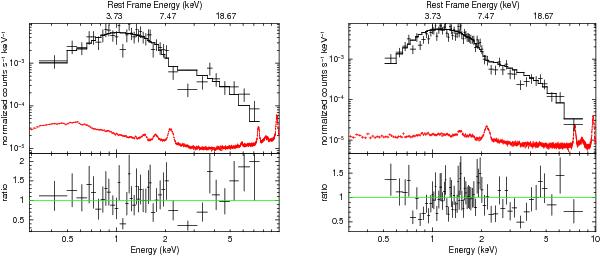
Left panel: observed Chandra 50 ks spectrum and residuals of HS 1700+6416, modeled with a power law modified by Galactic absorption plus intrinsic neutral absorption. The counts are binned to a minimum significant detection of 3σ (and a maximum of 15 counts per bin) only for plotting purposes. Right panel: observed Chandra spectrum and residuals of the source obtained from the eight observations of 2007. The same model and binning strategy as in the left panel are used. The Chandra background is shown in red.
Current usage metrics show cumulative count of Article Views (full-text article views including HTML views, PDF and ePub downloads, according to the available data) and Abstracts Views on Vision4Press platform.
Data correspond to usage on the plateform after 2015. The current usage metrics is available 48-96 hours after online publication and is updated daily on week days.
Initial download of the metrics may take a while.