Fig. 4
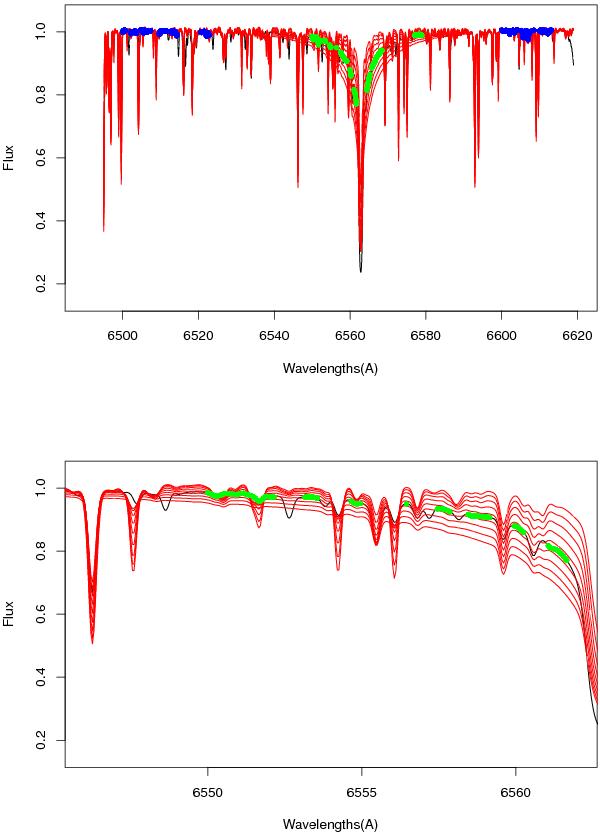
Comparison of the Hα wings in the studied spectrum (black line) with the 1D grid of synthetic spectra (red lines) ranging here from 5000 (narrowest wings) to 6600 K (broadest wing). The pseudo-continuum area is labeled with blue dots and the valid pixels in the Hα wings are identified with green crosses. The bottom plot is a zoom on the blue wing.
Current usage metrics show cumulative count of Article Views (full-text article views including HTML views, PDF and ePub downloads, according to the available data) and Abstracts Views on Vision4Press platform.
Data correspond to usage on the plateform after 2015. The current usage metrics is available 48-96 hours after online publication and is updated daily on week days.
Initial download of the metrics may take a while.