Fig. 3
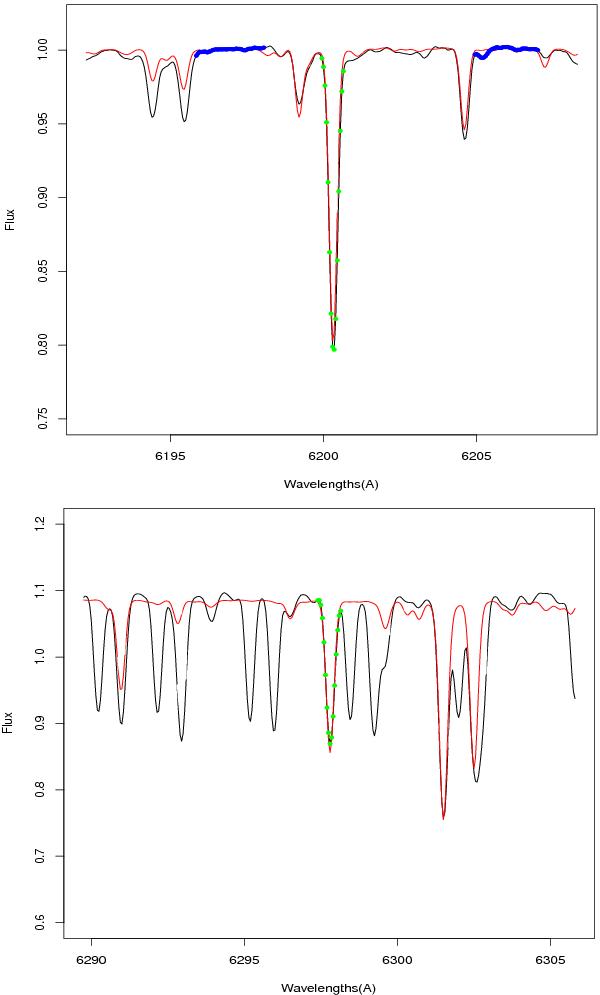
Two examples: (i) pixel identification in the reference line (green crosses), (ii) pseudo-continuum selection (blue circles), and (iii) vertical adjustment of the synthetic reference spectrum (red line) to the studied spectrum (black line). In the top plot, the pseudo-continuum area (blue circles) were selected automatically by SPADES and were used for the vertical adjustment. In the bottom plot, no valid pseudo-continuum area was found. The pixels in the line (green crosses) were used for the vertical adjustment.
Current usage metrics show cumulative count of Article Views (full-text article views including HTML views, PDF and ePub downloads, according to the available data) and Abstracts Views on Vision4Press platform.
Data correspond to usage on the plateform after 2015. The current usage metrics is available 48-96 hours after online publication and is updated daily on week days.
Initial download of the metrics may take a while.