Fig. 8
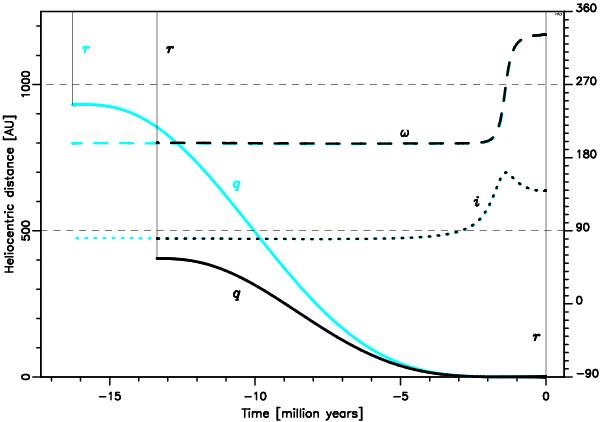
Backward dynamical evolution of C/2002 T7 for a nominal VC from the PRE+GEN swarm (cyan/grey) and PRE+STD swarm (in black). The evolution of the perihelion distance (thick solid line) and the heliocentric distance (thin solid lines) are shown with the left vertical axis in AU. The right vertical axis in degrees corresponds to the plots of the argument of perihelion (thick dashed line) and the inclination (dotted line), both in the Galactic reference frame.
Current usage metrics show cumulative count of Article Views (full-text article views including HTML views, PDF and ePub downloads, according to the available data) and Abstracts Views on Vision4Press platform.
Data correspond to usage on the plateform after 2015. The current usage metrics is available 48-96 hours after online publication and is updated daily on week days.
Initial download of the metrics may take a while.