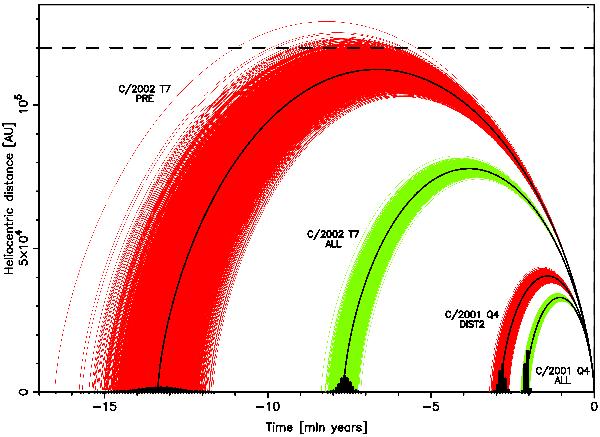
Fig. 6

The comparison of the backward dynamical evolution of the VC swarms of C/2002 T7 and C/2001 Q4. For each comet, two different swarms are shown: a green (light grey) based on all astrometric data and a red (dark grey) representing our preferred data model for a particular comet (PRE for C/2002 T7 and DIST2 for C/2001 Q4). In each case, the nominal orbit is drawn in black. We show also in black, the histograms of the swarm density at the moment of a previous perihelion passage. The horizontal dashed line depicts the “escape limit” of 120 000 AU used in our investigations.
Current usage metrics show cumulative count of Article Views (full-text article views including HTML views, PDF and ePub downloads, according to the available data) and Abstracts Views on Vision4Press platform.
Data correspond to usage on the plateform after 2015. The current usage metrics is available 48-96 hours after online publication and is updated daily on week days.
Initial download of the metrics may take a while.


