Fig. 5
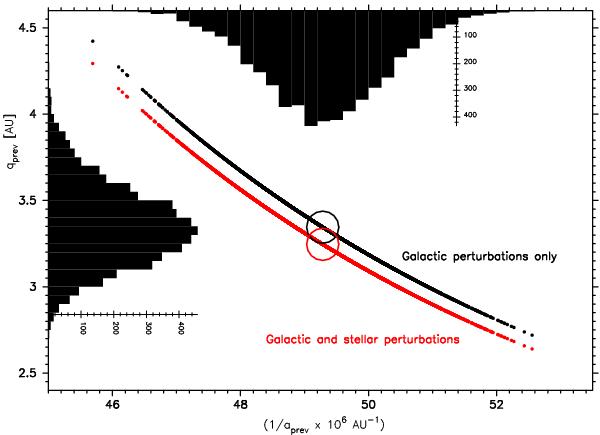
The dependence of the previous perihelion distance on the reciprocal of the previous semimajor axis for C/2001 Q4 (DIST2 variant with the standard NG model). Each dot in the central part of figure represents an individual cometary orbit from the swarm of 5000 VC orbits propagated to the previous perihelion (~3 million years back in time). Results of two different calculations are shown: without stellar perturbations (the central upper plot) and with stellar perturbation included (the lower one). The centres of the big circles define the positions of the respective nominal orbits. For the variant without stellar perturbations, boundary distributions of 1/aprev and qprev are also plotted.
Current usage metrics show cumulative count of Article Views (full-text article views including HTML views, PDF and ePub downloads, according to the available data) and Abstracts Views on Vision4Press platform.
Data correspond to usage on the plateform after 2015. The current usage metrics is available 48-96 hours after online publication and is updated daily on week days.
Initial download of the metrics may take a while.