Fig. 4
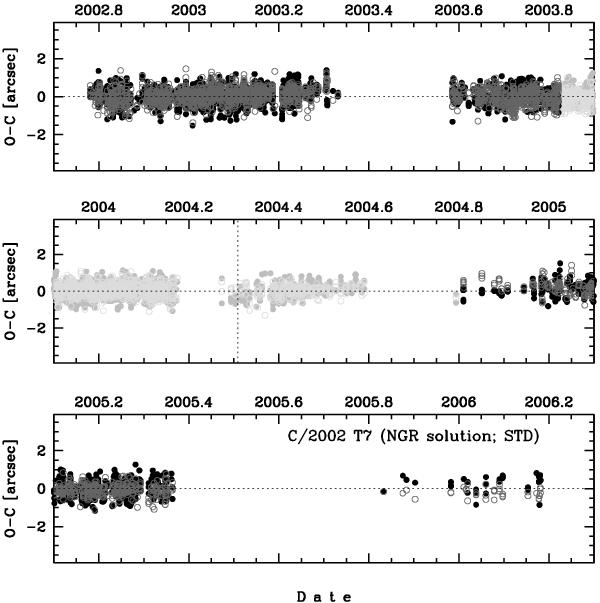
The O–C diagram for comet C/2002 T7 LINEAR for two separate NG models of a standard acceleration derived for two complementary data sets. Residuals for the NG model based on the DIST data sets (observations taken when the comet was further than 3.0 AU from the Sun, see Sect. 3.1) are shown by black dots and dark grey circles (residuals in right ascension and declination, respectively). The other NG model was derived for the remaining data (taken when the comet was closer than 3.0 AU from the Sun) and residuals are shown in light grey; the moment of perihelion passage is shown by a dashed vertical line.
Current usage metrics show cumulative count of Article Views (full-text article views including HTML views, PDF and ePub downloads, according to the available data) and Abstracts Views on Vision4Press platform.
Data correspond to usage on the plateform after 2015. The current usage metrics is available 48-96 hours after online publication and is updated daily on week days.
Initial download of the metrics may take a while.