Fig. 3
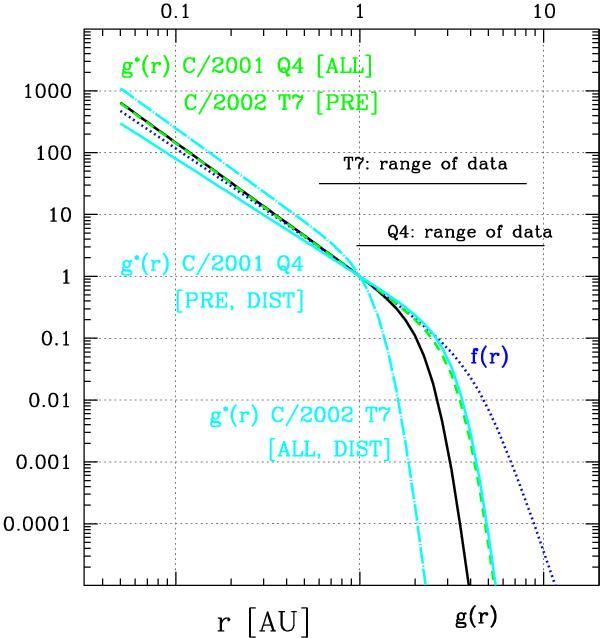
Different forms of the NG function h(r) versus (vs.) heliocentric distance r (Eqs. (3)–(5)) investigated in this paper. Standard g(r) is shown with a black curve, and a Yabushita function f(r) with a dotted blue (dark grey) one. From top to bottom, according to description given in the figure: dashed green/grey (m = −2.15, r0 = 4.0), solid cyan/grey (m = −1.9, r0 = 4.0), and dotted-dashed cyan/grey (m = −2.15, r0 = 1.5) curves represent the best derived g(r)-like functions for the comets C/2001 Q4 and C/2002 T7 for three types of data (ALL, PRE, and DIST, see Sect. 3.1).
Current usage metrics show cumulative count of Article Views (full-text article views including HTML views, PDF and ePub downloads, according to the available data) and Abstracts Views on Vision4Press platform.
Data correspond to usage on the plateform after 2015. The current usage metrics is available 48-96 hours after online publication and is updated daily on week days.
Initial download of the metrics may take a while.