Fig. 2
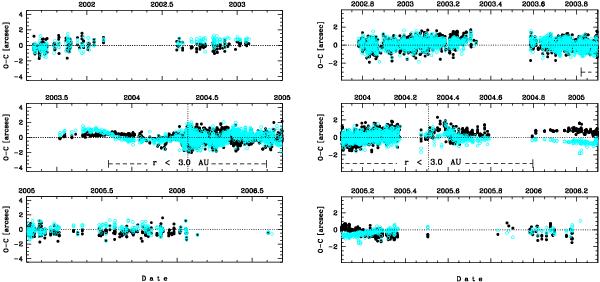
The O–C diagrams for comets C/2001 Q4 NEAT (left panel) and C/2002 T7 LINEAR (right panel) for NG model of standard acceleration and all available data (model ALL+STD, see Sect. 3). The residuals in right ascension are shown as black dots and in declination as cyan/grey circles; the moment of perihelion passage is shown by a dashed vertical line, and a dashed horizontal line corresponds to regions where data were taken at small heliocentric distances (r < 3.0 AU).
Current usage metrics show cumulative count of Article Views (full-text article views including HTML views, PDF and ePub downloads, according to the available data) and Abstracts Views on Vision4Press platform.
Data correspond to usage on the plateform after 2015. The current usage metrics is available 48-96 hours after online publication and is updated daily on week days.
Initial download of the metrics may take a while.