Fig. 7
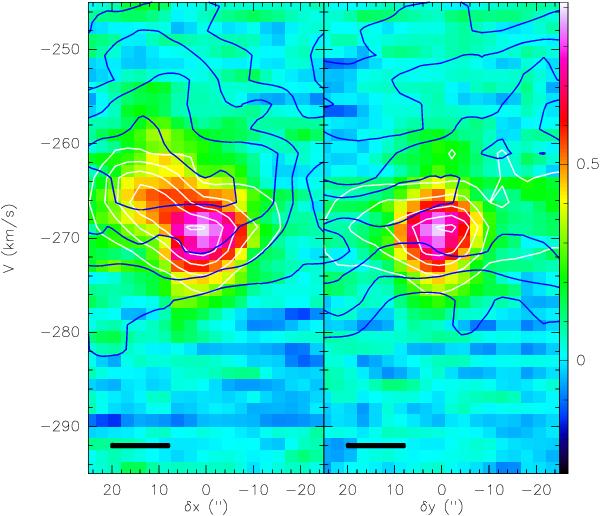
Position-velocity plots along the two arms of the observed HIFI cross. Left: perpendicular to the major axis of the galaxy, right: along the major axis of the galaxy. For each plot the color bitmap is the [C ii] in main beam temperature (Kelvins), the white contours are the CO(2−1) Tmb temperature every 0.1 K starting from 0.1 K, the dark blue contours are the H i temperature every 10 K starting from 10 K. The horizontal bar at the bottom of each panel indicates the 12′′ beamsize of the observations.
Current usage metrics show cumulative count of Article Views (full-text article views including HTML views, PDF and ePub downloads, according to the available data) and Abstracts Views on Vision4Press platform.
Data correspond to usage on the plateform after 2015. The current usage metrics is available 48-96 hours after online publication and is updated daily on week days.
Initial download of the metrics may take a while.