Fig. 4
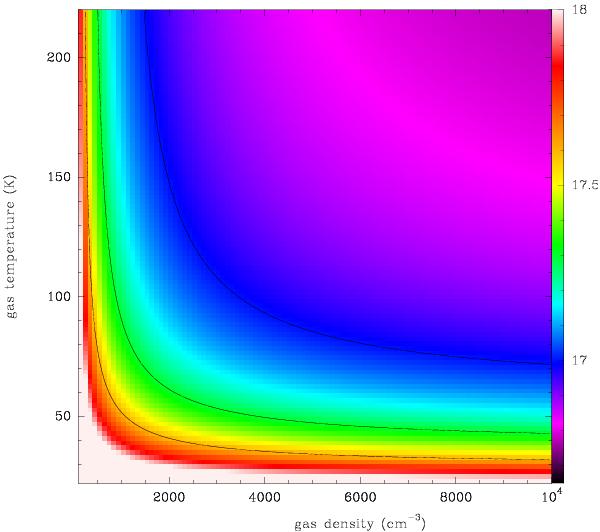
Log of the C+ column density as a function of gas density and temperature for the [C ii] intensity at the (0, 0) position of I [C ii] = 7.0 × 10⁻⁵ erg cm-2 s-1 sr-1. The bottom of the color scale (black) shows the high-temperature high density limit from Eq. (2) which yields log(NC + ) ≥ 16.65 – in the range of parameter space presented here, the limit is not reached. The column densities are for optically thin emission. Contours are plotted at column densities of log(NC+) = 17, 17.3, and 17.6. We have used Eq. (A1) from Crawford et al. (1985) assuming a critical density of 3000 cm-3.
Current usage metrics show cumulative count of Article Views (full-text article views including HTML views, PDF and ePub downloads, according to the available data) and Abstracts Views on Vision4Press platform.
Data correspond to usage on the plateform after 2015. The current usage metrics is available 48-96 hours after online publication and is updated daily on week days.
Initial download of the metrics may take a while.