Fig. 2
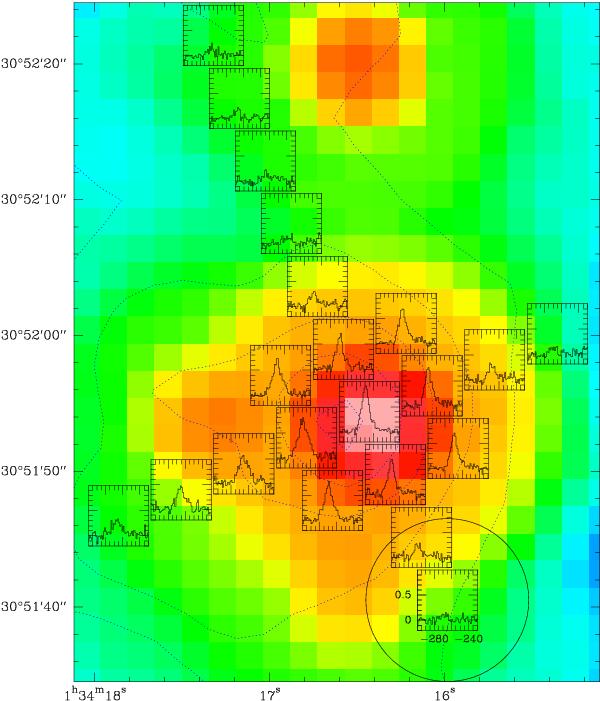
[C ii] spectra superposed on a Spitzer 24 μm image at 6′′ resolution of BCLMP 691. The dotted blue contours show the Hα emission at levels of 100, 300, 1000, 3000, and 10 000 counts (Greenawalt 1998; Hoopes & Walterbos 2000). Only positions with detected [C ii] flux are shown. The velocity scale is from −300 to −230 km s-1 and the y axis is from −0.2 K to 1 K. The beamsize is shown as a circle around the southernmost spectrum.
Current usage metrics show cumulative count of Article Views (full-text article views including HTML views, PDF and ePub downloads, according to the available data) and Abstracts Views on Vision4Press platform.
Data correspond to usage on the plateform after 2015. The current usage metrics is available 48-96 hours after online publication and is updated daily on week days.
Initial download of the metrics may take a while.