Fig. 1
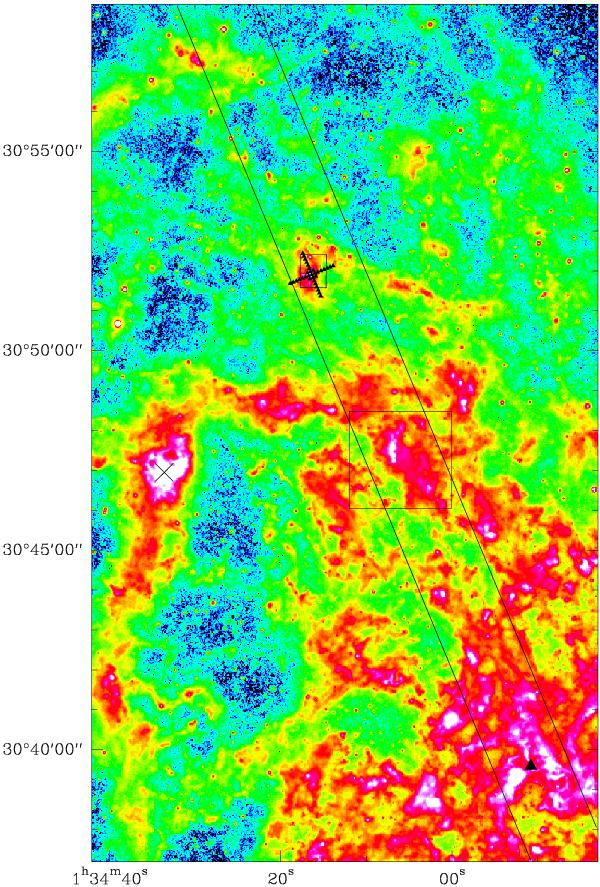
North-eastern part of M 33 in the IRAC 8 μm band (Verley et al. 2007). The upper (small) rectangle shows the region presented in Fig. 2 and the small triangles forming an “X” in and around the rectangle indicate the individual positions of the [C ii] HIFI observations. The large lower rectangle shows the region around BCLMP302 observed with PACS by Mookerjea et al. (2011). The center of M 33 is at the position of the triangle to the lower right of the image of M 33. The giant H ii region NGC 604 can be seen as the very bright region to the left around Dec 30:47 and is marked with a × .
Current usage metrics show cumulative count of Article Views (full-text article views including HTML views, PDF and ePub downloads, according to the available data) and Abstracts Views on Vision4Press platform.
Data correspond to usage on the plateform after 2015. The current usage metrics is available 48-96 hours after online publication and is updated daily on week days.
Initial download of the metrics may take a while.