Fig. 9
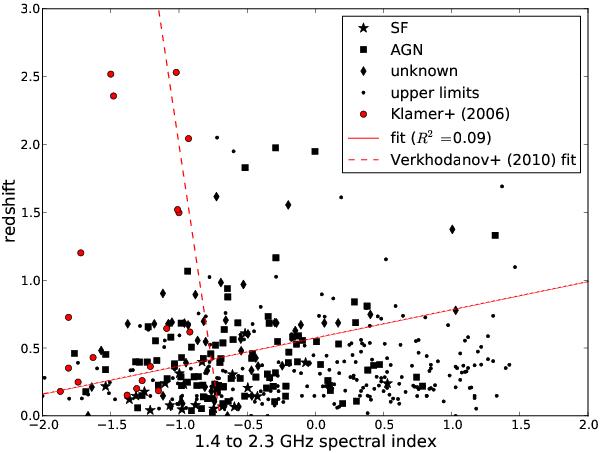
Redshift versus spectral index plot for all sources with spectroscopic redshift in our sample.Sources with an actual measurement of α are split in spectroscopic classes (AGN: black square, SF: black star, unknown: black diamond). Sources with an upper limit on α only (black dots) were not split up. Note that R2 = 0.09 for the fit to our data points (black symbols) indicates highly uncorrelated quantities. A slight correlation is usually assumed when R2 > 0.5 with good correlation for R2 > 0.85.
Current usage metrics show cumulative count of Article Views (full-text article views including HTML views, PDF and ePub downloads, according to the available data) and Abstracts Views on Vision4Press platform.
Data correspond to usage on the plateform after 2015. The current usage metrics is available 48-96 hours after online publication and is updated daily on week days.
Initial download of the metrics may take a while.