Free Access
Fig. 7
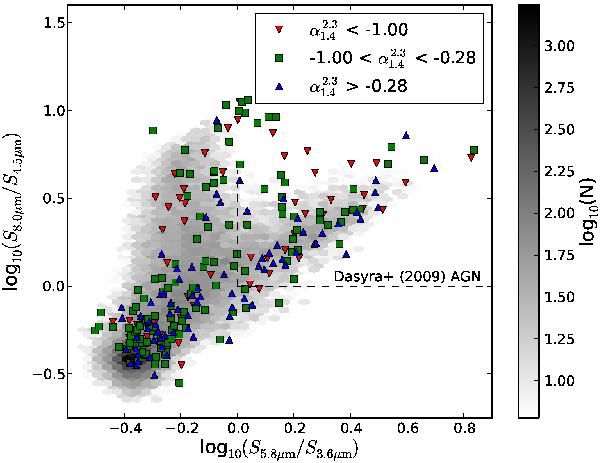
“Lacy diagram” of our source sample. For comparison, all sources detected in all four IRAC bands within the SWIRE survey of ELAIS-S1 and CDF-S are plotted as 2-dimensional histogram. The black dashed line indicates the locus of AGN in this diagram as proposed by Dasyra et al. (2009).
Current usage metrics show cumulative count of Article Views (full-text article views including HTML views, PDF and ePub downloads, according to the available data) and Abstracts Views on Vision4Press platform.
Data correspond to usage on the plateform after 2015. The current usage metrics is available 48-96 hours after online publication and is updated daily on week days.
Initial download of the metrics may take a while.