Fig. 5
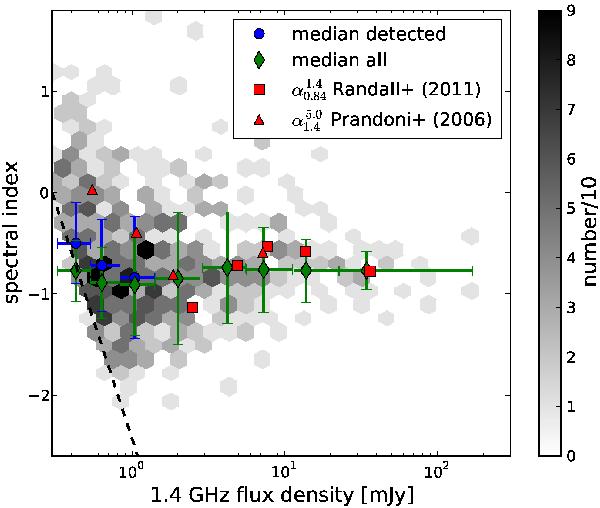
Spectral index vs. flux density. The grey 2D histogram shows our sample of 631 sources with 1.4 GHz and 2.3 GHz detections. Since the sensitivity of the 2.3 GHz observations is ~3 times lower than that of the 1.4 GHz data, the black dashed line indicates the minimum spectral index that could be measured with our data. Therefore, the median spectral indices (blue circles, x-error bars indicate the flux density bin size, y-error bars correspond to the MAD) for just the 2.3 GHz detected sample show significantly flatter values towards lower flux densities. When including also upper limits from the 2.3 GHz non-detected sources, this trend completely vanishes (blue diamonds). Hence we conclude that there is no evidence for a flattening of the mean spectral index with lower flux density.
Current usage metrics show cumulative count of Article Views (full-text article views including HTML views, PDF and ePub downloads, according to the available data) and Abstracts Views on Vision4Press platform.
Data correspond to usage on the plateform after 2015. The current usage metrics is available 48-96 hours after online publication and is updated daily on week days.
Initial download of the metrics may take a while.