Free Access
Fig. 1
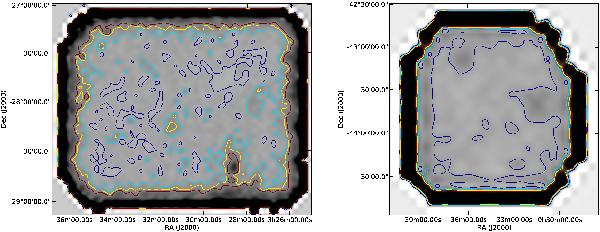
2.3 GHz noise maps of both ATLAS fields: CDF-S (left) and ELAIS-S1 (right). Contours start at 70 μJy beam-1 (dark blue contour line) and increase by a constant value of 40 μJy beam-1.
Current usage metrics show cumulative count of Article Views (full-text article views including HTML views, PDF and ePub downloads, according to the available data) and Abstracts Views on Vision4Press platform.
Data correspond to usage on the plateform after 2015. The current usage metrics is available 48-96 hours after online publication and is updated daily on week days.
Initial download of the metrics may take a while.