Fig. 9
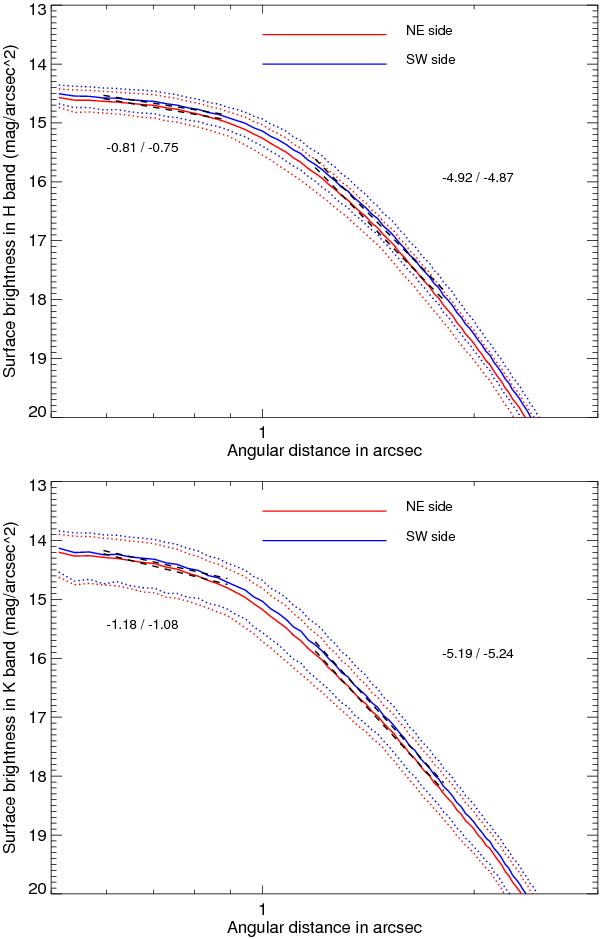
Surface brightness expressed in mag/arcsec2 as measured for the model with parameters i = 88°, r0 = 110 AU, αout = −5, αin = 5, g = 0.50 (top), corresponding to the H band and for the parameters i = 88°, r0 = 110 AU, αout = −5, αin = 2, g = 0.50, corresponding to the Ks band. Red and blue lines stand for the NE and SW sides, respectively. Dotted lines show the disk intensity dispersion at 1σ within the slit window of 0.25′′. Dashed lines correspond to the fitted power-law profile next to which the slopes are indicated.
Current usage metrics show cumulative count of Article Views (full-text article views including HTML views, PDF and ePub downloads, according to the available data) and Abstracts Views on Vision4Press platform.
Data correspond to usage on the plateform after 2015. The current usage metrics is available 48-96 hours after online publication and is updated daily on week days.
Initial download of the metrics may take a while.