Fig. 7
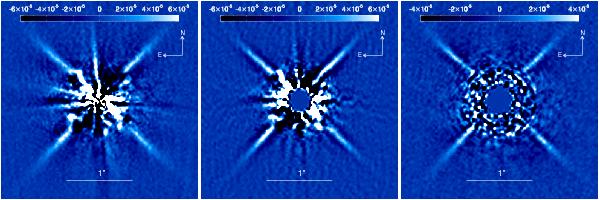
Images of the best-fit disk model (PA = 137.4°) in Ks compared to the observed disk (PA = 47.4°) with cADI, rADI, and LOCI algorithms (left to right). The field of view of each sub-image is 3 × 3′′. Color bars indicate the contrast with respect to the star per pixel (which is not applicable to the display-saturated central residuals).
Current usage metrics show cumulative count of Article Views (full-text article views including HTML views, PDF and ePub downloads, according to the available data) and Abstracts Views on Vision4Press platform.
Data correspond to usage on the plateform after 2015. The current usage metrics is available 48-96 hours after online publication and is updated daily on week days.
Initial download of the metrics may take a while.