Fig. 6
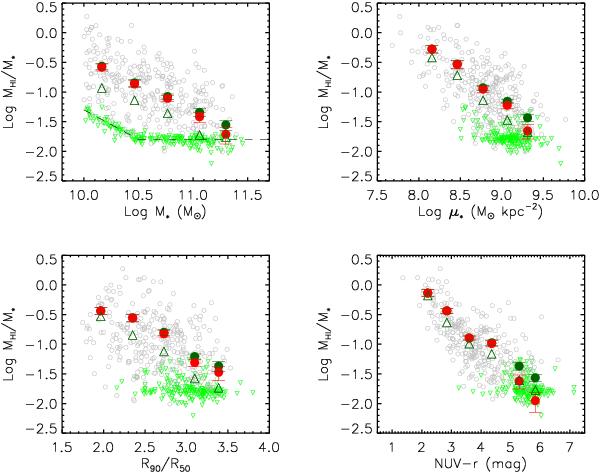
Average trends of Hi mass fraction as a function of stellar mass, stellar mass surface density, concentration index and observed NUV − r color for the representative sample. In each panel, large circles indicate weighted average gas fractions (see text). These were computed including the non-detections, whose Hi mass was set to either its upper limit (dark green) or to zero (red). Green triangles are weighted medians. Only averages based on at least 8 galaxies are shown. These results are listed in Table 1. GASS data from Fig. 5 are shown in gray and green (for detections and non-detections, respectively). The dashed line in the first panel shows the Hi detection limit of GASS.
Current usage metrics show cumulative count of Article Views (full-text article views including HTML views, PDF and ePub downloads, according to the available data) and Abstracts Views on Vision4Press platform.
Data correspond to usage on the plateform after 2015. The current usage metrics is available 48-96 hours after online publication and is updated daily on week days.
Initial download of the metrics may take a while.