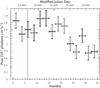
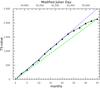
Fig. 3

Left: flux time history of 2FGL J1045.0−5941 in the 0.2 to 10 GeV energy band obtained by likelihood analysis. Each bin represents 2.5 months of data. The flux error bars are of 1σ type. The dashed vertical line indicates the time of the periastron passage of the η Car binary system (e.g., Parkin et al. 2009). Right: cumulative TS-value evaluation of 2FGL J1045.0−5941 as obtained by likelihood analysis in the 0.2 to 10 GeV energy band. Each data point represents the cumulative TS-value of the source for the time interval from the start of the Fermi-LAT data taking. The dotted blue line is a linear fit to the first nine data points. The dashed green line connects the origin and the cumulative TS-value obtained last.
Current usage metrics show cumulative count of Article Views (full-text article views including HTML views, PDF and ePub downloads, according to the available data) and Abstracts Views on Vision4Press platform.
Data correspond to usage on the plateform after 2015. The current usage metrics is available 48-96 hours after online publication and is updated daily on week days.
Initial download of the metrics may take a while.