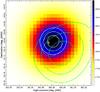
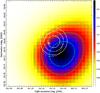
Fig. 1

Test statistic (TS) maps of the celestial region around 2FGL J1045.0−5941 as obtained by likelihood analysis. The TS-value corresponds to the likelihood of the source being located in a specific grid point. Left plot: 0.2 to 10 GeV, right plot: 10 to 300 GeV. The confidence contours (green for the high band, white for the low band) mark the 68.3%, 95.4% and 99.7% uncertainty regions for the location of the source of interest. The dashed yellow circle marks the catalogued 95% source location region of 2FGL J1045.0−5941. The nominal position of η Car is indicated by the yellow cross.
Current usage metrics show cumulative count of Article Views (full-text article views including HTML views, PDF and ePub downloads, according to the available data) and Abstracts Views on Vision4Press platform.
Data correspond to usage on the plateform after 2015. The current usage metrics is available 48-96 hours after online publication and is updated daily on week days.
Initial download of the metrics may take a while.