Fig. 9
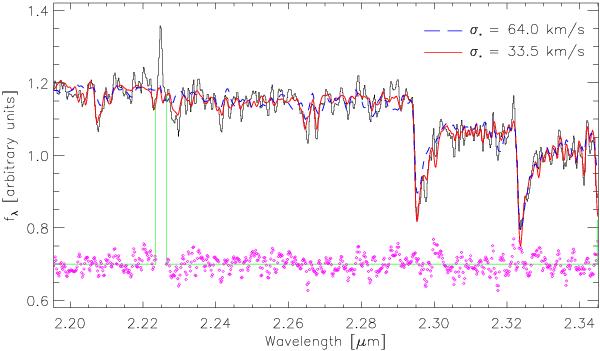
Fit of the stellar kinematics of the K-band spectrum integrated over an aperture r = re = 160 pc. The observed spectrum is shown as a thin solid line. Two different fits to the data are shown: the one obtained when using the whole stellar NIFS library (blue dashed line) and the one with the selected NIFS stellar templates (red solid line). Small spectral regions with emission or spurious lines were masked for the fit and in the plot are delimited by the vertical lines. The residuals, shifted vertically for clarity, are shown at the bottom with dots.
Current usage metrics show cumulative count of Article Views (full-text article views including HTML views, PDF and ePub downloads, according to the available data) and Abstracts Views on Vision4Press platform.
Data correspond to usage on the plateform after 2015. The current usage metrics is available 48-96 hours after online publication and is updated daily on week days.
Initial download of the metrics may take a while.