Fig. 4
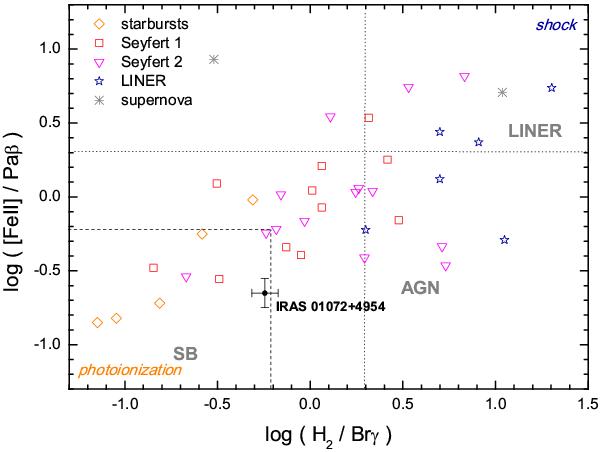
NIR diagnostic diagram. The line ratios obtained from the central region of IRAS 01072+4954 are shown in comparison to the ones calculated from non-spatially resolved observations of other sources taken from the literature. The different type of activity in those objects is represented as shown in the label. The observational division between starbursts, Seyferts and LINERS are shown by dashed lines. The ratio [Fe ii]λ1.644 μm/Brγ was converted to [Fe ii]λ1.257 μm/Paβ using theoretical values as explained in the text.
Current usage metrics show cumulative count of Article Views (full-text article views including HTML views, PDF and ePub downloads, according to the available data) and Abstracts Views on Vision4Press platform.
Data correspond to usage on the plateform after 2015. The current usage metrics is available 48-96 hours after online publication and is updated daily on week days.
Initial download of the metrics may take a while.