Fig. 3
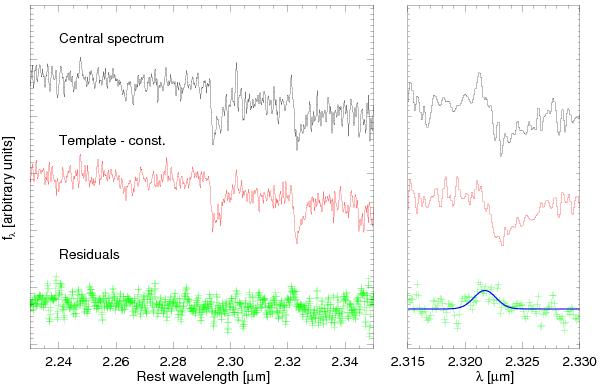
Coronal [Ca viii] emission in the central spectrum. The spectrum on top is extracted from the center with an aperture of the size of the PSF. The spectrum in the middle is the constructed stellar template, which is shifted vertically for clarity. The residuals from the subtraction of the latter from the former are shown with crosses. In the right panel we show a zoom-in around the [Ca viii] spectral position and the fit of the line.
Current usage metrics show cumulative count of Article Views (full-text article views including HTML views, PDF and ePub downloads, according to the available data) and Abstracts Views on Vision4Press platform.
Data correspond to usage on the plateform after 2015. The current usage metrics is available 48-96 hours after online publication and is updated daily on week days.
Initial download of the metrics may take a while.