Fig. 11
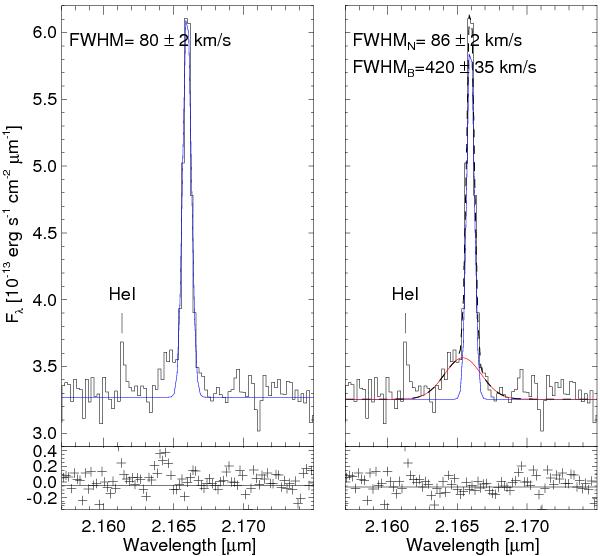
Fit of the Brγ line emission. A single Gaussian fitted to the data is shown in the left panel. The right panel shows the data fitted with two Gaussians, where the thin solid lines correspond to the individual components and the dashed line to the overall fit. The FWHM of the fitted lines are marked in each case. At the bottom of both panels the residuals of the individual fits are marked with crosses.
Current usage metrics show cumulative count of Article Views (full-text article views including HTML views, PDF and ePub downloads, according to the available data) and Abstracts Views on Vision4Press platform.
Data correspond to usage on the plateform after 2015. The current usage metrics is available 48-96 hours after online publication and is updated daily on week days.
Initial download of the metrics may take a while.