Fig. 10
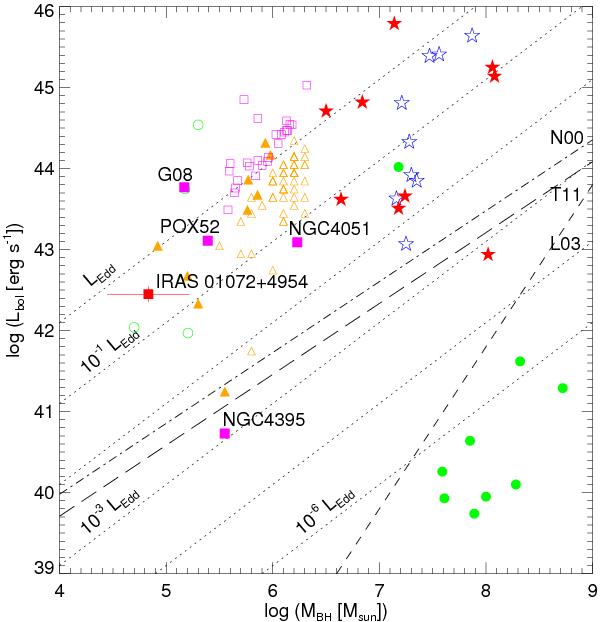
Black hole mass vs. bolometric luminosity diagram. The dotted lines correspond to different Eddington ratios. Theoretical upper limits of True-Sy2s predicted by different authors are also marked: Nicastro (2000, N00) (dot-dashed line), Laor (2003, L03) (short-dashed line) and Trump et al. (2011, T11) (long-dashed line). The location of IRAS 01072+4954 is compared with other sources from the literature. Sy1 and Sy2 from Singh et al. (2011) are symbolized as filled-red and empty-blue stars, respectively; IMBH compiled by Dewangan et al. (2008) and by Greene & Ho (2007a) are solid and empty orange triangles; True-Sy2 candidates of Laor (2003) and low-MBH Sy2s from Thornton et al. (2009) are filled and empty green circles, respectively. NLSy1s with FWHMbroad,Hα ≤ 700 km s-1 from the sample of Zhou et al. (2006) are plotted with empty magenta squares. Other well-known NLSy1s: NGC 4395, NGC 4051, and SDSS J114008.71+030711.4 indicated as “G08”, and the dwarf-elliptical Sy1 POX 52 are marked with filled magenta squares.
Current usage metrics show cumulative count of Article Views (full-text article views including HTML views, PDF and ePub downloads, according to the available data) and Abstracts Views on Vision4Press platform.
Data correspond to usage on the plateform after 2015. The current usage metrics is available 48-96 hours after online publication and is updated daily on week days.
Initial download of the metrics may take a while.