Fig. 1
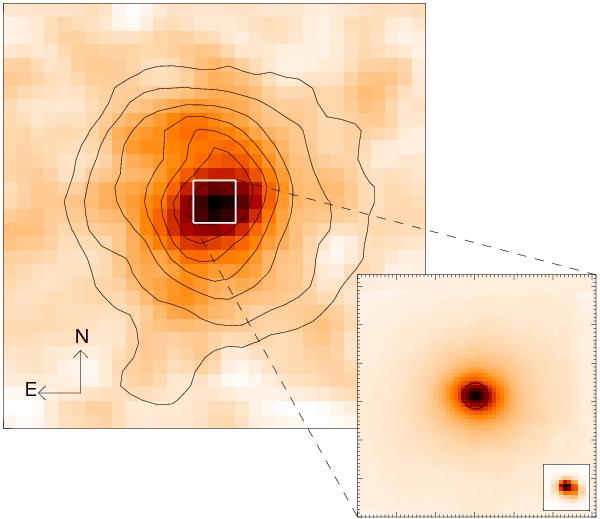
30′′ × 30′′ 2MASS K-band image of the galaxy IRAS 01072+4954. The overlaid contours correspond to the optical POSS-II image of the galaxy. The levels are 0.3, 0.4, 0.5, 0.6, 0.7, 0.8 and 0.9 of the optical peak flux. The central thick square represents the 3′′ × 3′′ NIFS FOV. The NIFS K-band continuum is shown in the amplified region. The tick marks on the borders indicate the pixel scale ~0.04′′. The image of the PSF reference star is shown at the bottom-right corner. For this study only the emission from the region enclosed by the circle at the center was considered.
Current usage metrics show cumulative count of Article Views (full-text article views including HTML views, PDF and ePub downloads, according to the available data) and Abstracts Views on Vision4Press platform.
Data correspond to usage on the plateform after 2015. The current usage metrics is available 48-96 hours after online publication and is updated daily on week days.
Initial download of the metrics may take a while.