Fig. 4
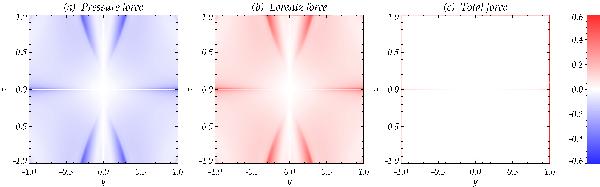
Contour plots of the different forces acting in the final equilibrium state in the x = 0 plane, for the same experiment as in Fig. 2. Showing, from left to right, the magnitude of the pressure force ( − | ∇p | ), of the Lorentz force and of the total force. Values are normalised to the maximum force of the initial state. It can be observed that the pressure and Lorentz forces balance each other and create a non-force-free equilibrium.
Current usage metrics show cumulative count of Article Views (full-text article views including HTML views, PDF and ePub downloads, according to the available data) and Abstracts Views on Vision4Press platform.
Data correspond to usage on the plateform after 2015. The current usage metrics is available 48-96 hours after online publication and is updated daily on week days.
Initial download of the metrics may take a while.