| Issue |
A&A
Volume 544, August 2012
|
|
|---|---|---|
| Article Number | A20 | |
| Number of page(s) | 8 | |
| Section | Planets and planetary systems | |
| DOI | https://doi.org/10.1051/0004-6361/201219181 | |
| Published online | 19 July 2012 | |
Methanol ice on the surface of minor bodies in the solar system
1 LESIA-Observatoire de Paris, CNRS, UPMC Univ Paris 06, Univ. Paris-Diderot, 5 place J. Janssen, 92195 Meudon Principal Cedex, France
e-mail: frederic.merlin@obspm.fr
2 Université Denis Diderot, Sorbonne Paris Cité, 75013 Paris, France
3 Institut de Planétologie et d’Astrophysique de Grenoble (IPAG), Université Joseph Fourier, Grenoble, France
Received: 7 March 2012
Accepted: 12 June 2012
Aims. Spectral analyses of trans-Neptunan objects (TNOs) and of the linked Centaurs, which are supposed to be among the most primitive minor bodies in the solar system, reveal some chemical and physical properties of their surface. To determine the surface composition of these objects and their surface evolution is essential for gaining clues on the conditions under which the solar system has been formed.
Methods. Chemical composition and physical properties of the surface of three objects have been constrained by computing the depth of the absorption features of the spectra in the near-infrared, running spectral models based on radiative transfer theory in the [0.4−2.3] μm range, and analyzing new laboratory measurements of the spectral behavior of thin samples of H2O-CH3OH mixtures.
Results. Our investigations allow us to confirm the presence of CH3OH ice on the surface of the Centaur (5145) Pholus and the resonant (55638) TNO 2002 VE95. It may also possibly be found on the classical TNO (120348) 2004 TY364. Our laboratory experiments indicate that the behavior of the methanol and water ice absorption bands is dependent on the ambient temperature and the dilution level of the mixture. These results also suggest that methanol may be diluted in water ice on the surface of the Centaur Pholus.
Conclusions. Formation and destruction processes of methanol suggest that a part (at least) of the surface of these objects is younger than the solar system age. If confirmed, this shows that primordial ices could still be detected on the surface of objects that are submitted to irradiation and rejuvenation processes.
Key words: techniques: spectroscopic / methods: data analysis / Kuiper belt objects: individual: (55638) 2002 VE95 / Kuiper belt objects: individual: (120348) 2004 TY364 / Kuiper belt objects: individual: (5145) Pholus / methods: laboratory
© ESO, 2012
1. Introduction
Trans-Neptunian objects (TNOs) are icy relics left over from the planetary accretion disk and orbit the Sun beyond Neptune. These bodies are unique tracers of the chemical, thermal, and dynamical history of our solar system and are divers in nature (see Barucci et al. 2008, for instance). Although TNOs are considered to be remnant objects in the solar system, their pristine material has been subjected to space weathering (by UV photolysis, solar wind radiation, cosmic rays, etc., see Strazzulla et al. 2003). Most of them possess no atmosphere and have chemically evolved surfaces. The smaller bodies have been depleted of volatile species and ices at different levels on the surface (Brunetto et al. 2006). Investigating their surface by spectroscopy is a tool for constraining the chemical properties and the evolution processes that occurr in the solar system. Unfortunately, most of the spectra of TNOs (Guilbert et al. 2009; Merlin et al. 2010a; or Barucci et al. 2011, for recent publications) are almost featureless in the visible as well as in the near-infrared (nIR) range and it is difficult to extract valuable information concerning the initial composition of these objects, the nature of the irradiated products and the role of each radiation source. This problem is important for objects that suffered much irradiation, therefore we need to focus our efforts on objects covered with relatively fresh ices.
Recent observations performed with 8-m-class telescopes allowed us to obtain new chemical information from nIR spectroscopy (Barucci et al. 2011). Most of these objects seem to be covered by water ice (see Barkume et al. 2008, for instance). The ice is itself covered with darker and/or redder organic materials or probably mixed with silicates. Other ices have also been firmly identified, such as methane (i.e.: Eris, see Brown et al. 2005; or Licandro et al. 2006, for example), nitrogen (i.e.: Pluto, see Douté et al. 1999, for example) and ammonia (i.e.: Charon, see Dumas et al. 2001, for instance). All of these ices could give valuable information on evolution processes that occurred in the outer solar system boundaries. This is helpful for constraining the effects of the space weathering (Hudson et al. 2008) or for constraining the models of collisions (Kenyon et al. 2008) and volatile loss (Schaller & Brown 2007).
The Haumea family is a good example, which shows the possibility to retrieve the evolution history of icy minor bodies. Indeed, Brown et al. (2007) discovered a whole family of objects with similar apparent spectro-photometric behavior and close dynamical properties. The investigations performed on the brightest components reported evidence of strong water ice bands (see Bakume et al. 2008; or Trujillo et al. 2011) and more interesting water ice in its crystalline phase (see Bakume et al. 2008; or Dumas et al. 2011). Taking into account the crystallization mechanism on the one hand (see for instance Jewitt & Luu 2004) and the effects of space weathering on the other hand (see for instance Mastrapa & Brown 2006), this implies that the crystalline water ice should be fresh. Its presence on the surface of the two major components (Haumea & Hi’iaka) could be explained by radiogenic heating or, under specific conditions, by tidal heating (Dumas et al. 2011). Other interesting objects that may provide new insights into the history of the solar system could be those that are covered by highly volatile species, such as methanol. Methanol is more volatile than H2O and CO2 and has been reported on the surface of several objects such as Pholus (see Cruikshank et al. 1998), 2002 VE95 (Barucci et al. 2006), and possibly 2004 TY364, 2004 UX10, 2008 FC76, and 2008 SJ236 (see Barucci et al. 2011). Methanol is expected to be mainly destroyed by space weathering (Hudson & Moore 1999) or could be lost by sublimation within 15 − 20 AU (Brown et al. 2011). Confirmation of methanol ice on the surface of dynamically different objects could give clear constraints on the evolution processes acting in the solar system.
Here we present new investigations of the surface of objects suspected to be covered by methanol, and more specifically, methanol mixed with water ice. This mixture is particularly interesting because of its possible pristine nature (these two ices are probably the most abundant ices in the proto-stellar and planetary disks, see Dartois et al. 1999). We first present new spectral analyses of the Centaur Pholus and a comparison with previous results from Cruikshank et al. (1998) to constrain the spectral features observed in the nIR range and investigate the spectral variations. Then, we will use these results with those obtained by Barucci et al. (2006, 2011) on the surface of the TNOs (55638) 2002 VE95 and 2004 TY364, on which the presence of methanol and water ice is possible, to compare the chemical and physical properties of the surface of these three dynamically different objects. Finally, we present new laboratory measurements that have been performed to constrain the spectral behavior of CH3OH-H2O mixtures depending on the ratio of each component and the ambient temperature.
2. Observations and data analyses
2.1. (5145) Pholus
Pholus has been observed several times during the last two decades in the visible (VIS) and in the nIR range with the 2.4 m Hiltner telescope, the UKIRT and the VLT facilities (see Cruikshank et al. 1998; Barucci et al. 2011). A complete VIS-nIR spectrum has been performed in the first half of the ’90s by Cruikshank et al. (1998). Here, we present the first complete VIS-nIR reflectance spectrum of this object based on the data obtained in 2008 by Barucci et al. (2011). These two VIS-nIR spectra are presented in Fig. 1. The phase angle is widely spread in the 1 − 6° range but mainly close to 5.4° before 1995 and close to 2° in 2008. According to the difference in phase angle range and the polarization of this object (Belskaya et al. 2010), we consider that an accurate comparison of the different sets of data will be difficult. The object probably has a diameter close to 150 km and an albedo close to 0.08 (Stansberry et al. 2008).
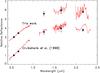 |
Fig. 1 Spectra of (5145) Pholus from 0.4 to 2.3 microns. We adopted the reflectance values determined by Cruikshank et al. (1998) to adjust the different parts of the spectrum. All spectra have been normalized at 0.55 μm and are shifted along the y-axis for clarity. |
The data of (5145) Pholus obtained in the visible are almost similar but we note a small slope variation of 3%/100 nm. The new data in the nIR have a low signal-to-noise level and a direct comparison does not show any variation, within the noise (Fig. 2). Considering that the phase angle might affect the reddening of the visible slope and the absorption behavior of the absorption features (Kolokolova et al. 2010), the small spectral variation can be caused either by the difference in observational circumstances or the real moderate chemical heterogeneity of the surface. This is also true for the spectral variations revealed by Cruikshank et al. (1998). However, the small V − R photometric variations observed by Farnham (2001) suggest that Pholus is moderately heterogeneous.
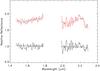 |
Fig. 2 Spectra of (5145) Pholus in the nIR and their differences (represented in the lower part as a continuous line with superimposed linear fit). The spectrum of 2008 (this work) is represented as a continuous line and that of Cruikshank et al. (1998) is represented as a dotted line. |
2.2. Comparison with other objects
Data of (55638) 2002 VE95 cover the 2003−2008 period. This object has been observed twice in the visible and three times in the nIR (see Barucci et al. 2006, 2012, for previous analyses of this object). This ~240 km object (albedo = 0.15, see Barucci et al. 2012) is a Plutino. All observations were made with a phase angle within the 0.5−0.9°. This narrow range of phase angles is favorable to good comparisons. The different spectra are presented in Fig. 3. The red slope of the visible spectrum of (55638) 2002 VE95 is different in the spectra obtained in 2003 and 2007 (see Barucci et al. 2012). The slope variation is about +6.5%/100 nm and quasi constant in the entire 0.43−0.85 μm range. In the nIR, no strong variations between data have been reported by the authors, which agree with the moderate heterogeneity of this object. According to the literature, four other objects that have been observed only once may also be covered by methanol ice (see Barucci et al. 2011). Among these objects, we concentrated our efforts on (120348) 2004 TY364, for which we have the spectrum with the highest signal-to-noise level. Observations of this object have been carried out in 2008 during the Large Program at VLT (ESO-Chile) by Barucci et al. (2011). This object is a classical one and its physical properties (diameter and albedo) are unknown. Its absolute magnitude is H = 4.5. For a moderate albedo of 0.10, the size of this object should be roughly 500 km. The phase angle was 0.9°.
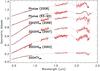 |
Fig. 3 Spectra of the three objects and the results of our spectral modeling. The fits are represented by continuous and dotted lines. The continuous lines show the wavelength ranges at which the models have been adjusted with the observations while the dotted lines follow the models outside these ranges. Except for 2004 TY364, all spectra and models have been shifted along the y-axis for clarity. |
To obtain more quantitative information from the spectra, we computed the absorption depth of the spectral features. The absorption band depth is calculated as the fractional difference in flux at 2.0 μm and 2.27 μm with respect to that at 2.2 μm. The depth of these two different bands are defined as  (1)and
  (2)This gives us an idea of the possible presence of water and methanol ices on the objects’ surfaces (with absorption bands located at 2.0 and 2.27 μm, respectively). Fluxes are computed as the median value of the flux between 1.98 − 2.02, 2.18 − 2.22 and 2.25 − 2.29 μm, respectively. The error assigned to each value comes directly from the standard deviation of the points used to compute the depth of the absorption band in each interval. The errors appear to be slightly overestimated compared to an accurate statistical approach, but have the advantage to be conservative. The results are reported in Table 1. These results confirm the relative homogeneity of the surface of 2002 VE95 and Pholus in the nIR. Indeed, the absorption features located around 2.0 and 2.27 μm are similar within the errors. In addition to the comparison of the spectra, we obtained a good confidence level of several absorption features (above 3σ). For the three objects, the absorption feature around 2.27 μm is at least observed once (both times for Pholus) and the absorption feature around 2.00 μm is well defined in one spectrum of Pholus and one spectrum of 2002 VE95. This latter absorption feature is not significant for the spectrum of Pholus obtained in 2008 and that of 2004 TY364. These analyses do not allow us to firmly detect water ice on the surface of 2004 TY364, and methanol could therefore be in pure state on its surface.
Absorption features.
2.3. Spectral models
To investigate the surface properties of these objects, we used the spectral model developed by Hapke (1981; 1993). The composition and physical parameters are obtained following the work described in Merlin et al. (2010a). The general approach is to use the chemical compounds that can account for the present signatures, and plausible compounds that can reproduce the general spectral behavior for these distant objects. The code allows iterating with varying components, quantities and grain sizes with a minimization of the chi square between the model and the observed data. This model works ideally with spectra obtained at very small phase angle, which is mostly the case here, except for the older spectrum of Pholus. Taking into account the works of Hapke (1986) or Pommerol & Schmitt (2008), we assumed that this could affect our results, at second order compared to the noise of the data, on the abundance and particle size of the chemical compounds that display absorption bands (i.e.: the ices in our case).
We ran models considering amorphous and crystalline water ice (Grundy & Schmitt 1998), olivine and pyroxene (see Barucci et al. 2012), triton, titan and ice tholins (Khare et al. 1986, 1993), methanol (Quirico et al. 1999), methane (Quirico & Schmitt 1997), amorphous carbon (Zubko et al. 1996), and kaolinite (Merlin et al. 2010b). Results of the best-fit models for the different spectra are reported in Table 2 and Fig. 3. The results were obtained using the albedo value in the V band of ρV = 0.08 for Pholus. Table 2 contains the percentage of the different components and particle sizes in microns and also reports the results for 2002 VE95 and 2004 TY364 published in the literature.
Results (in %) and size (in μm) of the composition and physical parameters obtained with the Hapke model (see text for details).
The models performed with the albedo constraints for 2002 VE95 and Pholus (from Hershel and Spitzer, respectively) confirm our first conclusions and allow us to obtain more details on the chemical properties of these two objects (see Fig. 3). The CH3OH amount could be comparable to water ice on the different surfaces (see Table 2). However, these results are model-dependent, and variation of the particle size, for instance, could affect the different ice contents (see Barucci et al. 2008, for some limits of the models). Among the different ices (methanol, ammoniac, methane, nitrogen, or ethane), also discovered on TNOs or icy satellites, methanol is the best candidate that fairly fits the absorption feature near 2.27 μm, even if we cannot completely exclude other possible materials (see Cruikshank et al. 1998, for other possible candidates). The presence of CH3OH on 2004 TY364 is particularly questionable since the modeled spectrum does not fit the entire spectral feature between 2.2 and 2.3 μm. This could be due to limits of the spectral models, to our restricted optical constants library, or to problems in the observational data set. Water ice is also favored in its amorphous phase; indeed, our attempt of using water ice in its crystalline phase gave less satisfying fits and the typical absorption feature of crystalline water ice at 1.65 μm is not clearly detected. In all cases, a better signal-to-noise level is required to better investigate these hypotheses. Because the red slopes of the objects are different, the chemical mixtures of organics are not the same. Triton and titan tholins seem to be the best candidates, but our results give only the best candidates among those chosen in input, and without firm detection of the absorption band we cannot deeply investigate the nature of the organics or silicates. For Pholus for instance, the change of 3%/100 nm in the red slope deeply modifies the amount of olivine in our models although it is difficult for this to be true (see Barucci et al. 2008, for more details on the limitations of the models). The rotation period of the objects is not yet known with good accuracy and it is not possible to link any spectral variations with rotation phase or temporal variation. The spectral features’ repeatability can suggest that water and methanol ices are probably present throughout the surface of 2002 VE95 and possibly throughout Pholus. Although methanol seems to be the best candidate to explain the absorption features around 2.3 μm (see Cruikshank et al. 1998, for a more detailed discussion for Pholus), some slight disagreements have been reported. While the absorption feature at 2.27 μm is fairly well reproduced, a second sharp band a 2.33 μm is not. Consequently, it is difficult to know if the 2.3 μm absorption band complex is caused not only by methanol or if the absorption features of this compound might be different from those reported by Cruikshank et al. (1998). These authors made laboratory measurements of pure methanol in the 90 − 120 K range but did not investigate dilution effects with water ice, although it was firmly identified on the surface of this Centaur.
3. Laboratory experiments
To investigate this possibility in more detail, we performed new laboratory measurements. Although properties of water ice are found in the literature for different states and temperatures, our knowledge of methanol ice and methanol/water ice mixture is still limited (see Tielens et al. 1984; d’Hendecourt & Allamandola 1986; Dartois et al. 1999; Ehrenfreund et al. 1999; and more recently Myszka et al. 2011, for a few dilution states at cold temperature). We performed our experiments at the Institut de Planétologie et d’Astrophysique de Grenoble (IPAG) to show the effects of dilution and temperature that can affect the spectral features of the H2O-CH3OH mixture.
3.1. Instrumentation and samples
We produced thin ice samples from the gas phase, allowing the formation of mixtures in the amorphous phase, which appears to be the case for the water ice on the surface of the objects. Gas mixtures were slowly condensed onto a cold (17 K) KBr window. The deposition rate and ultimate sample thickness (0.7 to 1.4 microns) were measured during deposition from the interference fringes of the transmitted and reflected beams of a He-Ne laser (beam incidence close to 45°). The deposition rate (sample growth rate) was near 1.0 micron h-1. The KBr window was cooled in a high-vacuum optical cell (initially close to 2 × 10⁻⁸ mbar), and placed in the sample compartment of the spectrometer. Infrared spectra from 4000 to 400 cm-1 of these samples at 0.5 cm-1 resolution were obtained with a Fourier transform infrared spectrometer (Nicolet 800). Inside the optical cell, a sample holder was fitted at the top of the cold finger of a closed-cycle He cryostat, with its temperature monitored using calibrated silicon diodes and a proportional-integral-derivative controller (Lake Shore DRC-93CA).
Spectra were recorded on heating and cooling and thus thermal history effects have been considered (in the 20 − 150 K range). Methanol ice could be in amorphous or crystalline phase. Its crystalline phase has itself three different phases (α, β and metastable phase) depending on temperature (Lucas et al. 2005). Its triple point is Tt = 175.61 K. We recorded different spectra in transmission for different samples and extracted the absorption coefficients. We took care of the mixing ratio and the volatile loss during all our measurements (especially after our heating procedures), computing the surface area of typical absorption bands present in our wavelength range.
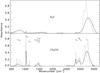 |
Fig. 4 Absorbance of pure methanol ice and almost pure water ice at 35 K in both states (amorphous phase as a continuous line and crystalline phase as a dotted line). Methanol contamination is expected to be lower than 6 − 7% for the almost pure water ice. |
3.2. Results
To investigate the mixing ratios of our samples, we first identified the absorption features in the whole 400 − 4000 cm-1 frequency range (2.5 − 25 μm) from a thin sample of pure methanol ice and that of almost pure water ice. Table 3 and Fig. 4 report the different bands that are also reported by d’Hendecourt & Allamandola (1986) and de Barros et al. (2011). Several bands are blended and are barely decoupled in the 1400 − 1550 cm-1 and 2900 − 3000 cm-1 ranges. In the first range, the ν12 overtones are embedded with the ν4, ν5 and ν10 vibration modes (the in plane asymmetric and symmetric bend modes and the out of plane asymmetric bend mode, respectively) while in the second range, the overtones of the ν4, ν5 and ν10 vibration modes are themselves embedded with the ν2 and ν9 modes, corresponding to the CH asymmetric stretch modes. The reported ν9 is also a complex of several modes and their interpretation and study is beyond the scope of this paper. Here, we will focus our efforts on the main variations that depend on the dilution state and temperature, particularly of the ν1, ν3, ν7, ν8 and ν12 vibration bands for CH3OH and the OH stretch and H2O libration bands for the water ice.
Absorption features of methanol.
All our samples have been heated up to 145 ± 5 K and then cooled down as low as 20 K. From our measurements, the crystallization of amorphous methanol and amorphous water ices occurred near 100 ± 5 K and 120 ± 5 K, respectively, associated with clear band duplication. The ν1 mode is centered near 3235 cm-1 in the amorphous phase and splitted into two bands at 3164 ± 2.0 cm-1 and 3272 ± 2.0 cm-1 at 35 K, just as the ν3 mode (2819 ± 1.0 and 2831 ± 1.0 instead of 2828 cm-1), the ν8 mode (1019 ± 1.0 and 1032 ± 1.0 instead of 1027 cm-1) and the ν12 mode (691 ± 2.0 and 793 ± 2.0 instead of 716 cm-1). The differences between both states are presented in Fig. 4. The spectra of methanol obtained in the crystalline form are very similar to that assigned to the metastable phase by Lucas et al. (2005) or Mate et al. (2009). These authors formed this phase by condensation in the 130−145 K temperature range or obtained by vapor deposition at 85 K followed by heating of the sample to 130 K, keeping the pressure at ~107 mbar. Here we confirm their work in so far as both methods seem to lead to the same methanol phase judging by the matching of their corresponding IR spectra. In our case, this phase seems to be reached by heating our sample to between 100 and 110 K from deposition at cold temperature.
3.2.1. Mixing ratio and temperature effects
We compared the absorption band surface of pure methanol ice just as the associated CO stretch vibration (ν8) or that of the CH3 rock vibration (ν7) with those of water or methanol ices such as those of the OH libration (for H2O) or torsion (ν12 for CH3OH) vibrations. Assuming that the sample of pure methanol is not contaminated by water, we obtained six different CH3OH:H2O mixing ratios; ~100:0, 95:5, 90:10, 48:52, 20:80 and 3:97 (mean mixing ratio error ± 5%). We were not able to obtain a pure water ice sample but the amount of methanol is very small in the last sample and can be used as reference for an almost pure water ice sample. The effects of the mixing ratio have been reported on the shape and the position of the vibration bands (see Fig. 5 for several examples). For instance, the ν1 band shape as well as the band peak position strongly depend on the mixing ratio. In the crystalline phase, the differences are even more obvious because of the duplication of the ν1 vibration band. Similar variations are also seen for the ν12 band. Our samples were not made in thermal equilibrium from liquid phase but our results indicate that the two components are intimately mixed. For instance, the spectral features of the 48:52 mixing ratio are completely different from those expected from a synthetic spectrum obtained with the same abundances of each pure compound (see Fig. 5, on the right). This could suggest the formation of mono hydrate CH3OH:H2O with mixing ratio 1:1. New laboratory measurements, made from the liquid phase, are required to investigate this topic.
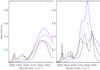 |
Fig. 5 Absorbance of pure and mixed ices between 2750 and 3400 cm-1 at 55 K for 1 micron thickness layers. On the left: amorphous phase of pure CH3OH (black), almost pure H2O (blue) and mixtures of both with CH3OH:H2O mixing ratio of 20:80 (red) and 48:52 (dash-point). On the right: ices are in crystalline phase and the same legend is used. The synthetic spectrum of a 48:52 mixing ratio obtained from pure methanol and water ices is plotted as a dotted line. (The color version is available in the electronic version.) |
While the mixing ratio mainly governs the shape of the absorption bands, the temperature mainly acts on the band peak location. This statement is made while neglecting, of course, the amorphous-crystalline phase transition. We report in Fig. 6 the band peak position of three different modes; the CH3OH torsion or the H2O libration, the CO stretch and the OH-stretch. At low temperature, the position is reported for the amorphous phase. The peak position of the H2O libration and the OH-stretch bands shift quasi linearly from 17 K to almost 120 K for mixtures with an H2O concentration greater than 80% (~+0.5 cm-1/K and ~−0.4 cm-1/K, respectively). The trend for the band peak position associated to the CH3OH torsion and OH-stretch modes for mixtures with CH3OH concentration greater than 90% is almost similar but the shifts are less pronounced when the ice is warmer than 55 K. In contrast to the last cases, the shift of the CO stretch-band peak position is negligible as are those concerning the ν2, ν3, ν4, ν5, ν9 and ν10 vibration modes (shifts lower than ± 0.1 cm-1/K). For the ~50:50 mixing ratio mixture, the results are comparable with those obtained with almost pure water ice or pure methanol ice (shift of ~+0.5 cm-1/K and ~−0.25 cm-1/K for the bands associated to the blend of CH3OH torsion/H2O libration and the OH-stretch, see Fig. 6). In the crystalline phase, the shifts of the band peak position agree with those reported in the amorphous phase but are somewhat smaller in all cases (up to a factor of 2, especially for the CH3OH torsion, the H2O libration and the OH-stretch modes).
The temperature of crystallization of CH3OH and H2O seems also dependent on the mixing ratio, according to Fig. 6. The crystallization should occur at about 100 ± 5 K for almost pure methanol ice (i.e.: concentration greater than 90%) and at about 125 ± 5 K for almost pure water ice (see the clear gaps in the peak position of the different bands in Fig. 6). However, the first gaps of the band peak position shift of the almost 50:50 mixing ratio suggest different crystallization temperatures; between 110 and 120 K. This variation could also suggest the formation of the monohydrate, as stated previously.
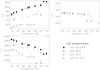 |
Fig. 6 Band peak position depending on the temperature for three vibration modes (or combination) and different dilution state. Top left: frequency of the absorption band associated to the CH3OH torsion or the H2O libration or a blend of both. Top right: frequency of the CO stretch vibration mode, only reported for a CH3OH:H2O mixing ratio with CH3OH greater than 40%. Bottom left: frequency of the absorption band associated to the OH-stretch. |
3.2.2. Expected effects in the near-infrared range
According to our laboratory measurements, the mixing ratio, the temperature and the crystallographic structure control the position and the shape of methanol bands. The vibration modes involving the OH bond are very sensitive to these parameters, because of the hydrogen bond that water establishes with the hydroxyl group of methanol (Figs. 5 and 6). A lesser effect is expected for the vibration modes of the methyl group -CH3, because they do not have a strong coupling with the vibration modes of water molecules. The 2.27 and 2.33 μm bands are assigned to four combinations of deformation with asymmetric and symmetric modes (ν4, ν5, ν9 and ν10), respectively (Cruikshank et al. 1998). The sensitivity of these two bands is difficult to assess experimentally, because films of amorphous ice cannot be grown above ~100 microns. However, the sensitivity of the 2.27 and 2.33 μm bands can be inferred from the fundamental methyl modes.
We looked at the region that contain the ν3, ν2 and ν9 vibration modes (Fig. 5). The examination of the sensitivity of these bands to the parameters described above requires the subtraction of the local background, mostly due to the wing of the intense OH band (Fig. 5). For this purpose, we fitted the OH band using a combination of Voigt profiles and subtracted this profile from the spectrum in the 2700 − 3000 cm-1 spectral region. This procedure could be applied to the spectra whose methyl bands were the most intense, obtained with the almost pure CH3OH and the 50:50 mixture samples.
We unambiguously observed that for both these mixtures at amorphous state at the same temperature, there is a real effect of dilution (Fig. 7). Indeed, in addition to the displacement of the bands toward shorter wavelengths, the depth of the ν9 and ν2 vibration modes relative to that of the ν3 vibration mode evolve. We furthermore infer that these effects should also occur at lower dilution level of CH3OH, because methanol would interact only with H2O molecules. Because synthetic mixtures made with pure water and methanol ices will not be able to reproduce the spectral features of a real mixture, disagreement between synthetic spectra and the objects’ spectra should be considered. The discrepancies presented for Pholus in Cruikshank et al. (1998), for instance, may be partially explained by the dependence with dilution of the 2.27 and 2.33 μm bands. Laboratory measurements in the nIR are mandatory to firmly conclude on this question and be able to retrieve more constraints on the CH3OH:H2O mixing ratio.
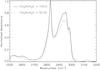 |
Fig. 7 Dilution effects between 2500 and 3200 cm-1 at 55K for a 1 micron thickness layer. Absorbance spectra were normalized for two cases. The first spectrum was obtained with almost pure CH3OH (continuous black line) and the second one using a mixture of CH3OH:H2O (mixing ratio close to 50:50 presented as a dash-point line). Both ices are in amorphous phase. |
4. Discussion
That we found methanol and water ice on the surface of three different dynamical objects is really interesting. Methanol forms mainly on ice-covered dust grain surfaces primarily through hydrogenation of CO in dark interstellar clouds or from an electron-irradiated H2O-CH4 icy mixture, followed by rapid ion-molecule reaction or by the insertion reaction: CH2+H2O (see Moore & Hudson 1998; Dartois et al. 1999; Wada et al. 2006; and Garrod & Pauly 2011, for instance). The amount of CH3OH, compared to CO, strongly depends on the time-scale and dust temperature. The yield of methanol also increases with the electron flux. Doses of a dozen eV/molecule-1 usually allow the production of 1015 to 1017 CH3OH molecules, depending on the target (CO or CH4) and radiation source according to the authors. From observations in the Serpens molecular core (Kristensen et al. 2010) for instance, the methanol abundance at outflow positions is enhanced by up to 2 − 3 orders of magnitude with respect to the ambient abundance. Energetic processes can enrich the molecular clouds in methanol ice up to the abundance of water ice (Garrod & Pauly 2011). Therefore, the discovery of methanol-water ice mixture on the surface of cold and primitive objects is not a surprise by itself (it is present in comets, see for instance Bockelée-Morvan et al. 2004). The presence of methanol is also suggested by Brown et al. (2011), just as other volatile species, to explain the colors and the albedos of the Centaurs and TNOs. These authors suggested that methanol ice might be one of the main chemical compounds required to form, from the space weathering, the reddest objects, and therefore the presence or absence of methanol ice on the surface of the moderately red object 2004 TY364 is important for this topic.
However, methanol and water ice are subjected to space weathering. Ferini et al. (2004) and Hudson & Moore (1999), for instance, showed that methanol can be transformed by ion irradiation. When the precursors are depleted (i.e. CH4 or CO) or when the grain has been processed in such a way that H2O no longer dominates the grain mantle, the abundance of CH3OH should decline. Because most of the objects are too small to keep their volatile species (see Schaller & Brown 2007), we assume that the production of methanol is not possible at the present stage of the objects. In contrast to comets that display methanol that comes from the protected interior of the nucleus, methanol on the surface of TNOs and Centaurs is not expected to survive a long time (see effects on different mixtures containing methanol in Gerakines et al. 1996). Brunetto et al. (2006) performed irradiation of a 1 micrometer CH3OH sample at different dose levels. With a dose equal to, or even lower than, to 44 eV/16 amu, the authors obtained a red crust in which the absorption features in the nIR almost completely disappeared. According to Cooper et al. (2003), a 100 eV/16 amu dose is expected to accumulate within the first microns of the surface in 1 billion years. This means that the observed methanol is unlikely to be related to the age of formation of these bodies and seems to imply processes able to exhibit this ice on the surface in the last billion years.
Our observations, which differ from those of the relatively small objects Pholus and 2002 VE95 seem to be coherent with global events on the bodies’ surface that could exclude minor collisions if the presence of methanol is confirmed with an accurate rotation survey. Cometary-like activity can be possible for the Centaur Pholus, such as observed for the Centaur Echeclus, which experienced this type of event on December 30, 2005 (Choi & Weissman 2006) at about 13.07 Astronomical Units (AU) from the Sun. Pholus reached its perihelion in 1991 at an heliocentric distance of 8.69 AU, which is a better condition for this type of phenomenon. However, cometary-like activity is unlikely for the two TNOs. Both of them are on stable orbits with perihelion distances exceeding 27 AU for 2002 VE95 and 36 AU for 2004 TY364. The surface temperature of the two objects is assumed to be always below 50 K using the Stefan-Boltzmann law and an albedo as low as 0.05 for 2004 TY364. It is far below the sublimation point of most ices such as water or methanol. Because these objects are not big enough to retain their volatile species as Pluto did (see Schaller & Brown 2007), we suggest that collisional events (already at work for the formation of classical TNOs of the Haumea family) appear to be the most probable phenomena to explain the presence of these ices on their surface.
5. Conclusions
Our observations seem to confirm the presence of methanol mixed with water ice on the surface of Pholus and 2002 VE95 mixed with water ice and probably different organics. We also detected the 2.27 μm band, which could be associated with methanol, on the surface of 2004 TY364, but this needs confirmation. This also implies that pristine material might still be observed on the surface of TNOs and Centaurs. Considering the irradiation doses received in the first micrometers of the surfaces, major and relatively recent events, probably have occurred on the surface of these three objects which are dynamically different. Our preliminary laboratory measurements, made on thin samples, show the effects of the temperature and the H2O:CH3OH mixing ratio in the 3 − 10 μm range with displacements and shape variation of the absorption bands. These results could reinforce the idea that the methanol-water ice mixture is a good candidate to explain the nIR features. This laboratory work should be extended to the 1.0 − 2.5 μm range to investigate the effect on the temperature and mixture ratio in this wavelength range and be able to fully interpret the spectra obtained from ground-based telescopes. Work on the formation/destruction processes on ices should also be performed to obtain some constraints on the age of the surfaces.
Acknowledgments
We are grateful to Olivier Brissaud for his help and support in the realization of the laboratory measurements and Bernard Schmitt for his advice on how to form the different samples performed in this study. We are also grateful to the anonymous referee whose comments improved the paper.
References
- Barkume, K. M., Brown, M. E., & Schaller, E. L. 2008, AJ, 135, 55 [NASA ADS] [CrossRef] [Google Scholar]
- Barucci, M. A., Merlin, F., Dotto, E., Doressoundiram, A., & de Bergh, C. 2006, A&A, 455, 725 [NASA ADS] [CrossRef] [EDP Sciences] [Google Scholar]
- Barucci, M. A., Brown, M. E., Emery, J. P., & Merlin, F. 2008, The Solar System Beyond Neptune, 143 [Google Scholar]
- Barucci, M. A., Alvarez Candal, A., Merlin, F., et al. 2011, Icarus, 214, 297 [NASA ADS] [CrossRef] [Google Scholar]
- Barucci, M. A., Merlin, F., Perna, D., et al. 2012, A&A, 539, A152 [NASA ADS] [CrossRef] [EDP Sciences] [Google Scholar]
- Belskaya, I., Bagnula, S., Barucci, M. A., et al. 2010, Icarus, 210, 472 [NASA ADS] [CrossRef] [Google Scholar]
- Bockelée-Morvan, D., Biver, N., Colom, P., et al. 2004, Icarus, 167, 113 [NASA ADS] [CrossRef] [Google Scholar]
- Brown, M. E., Trujillo, C. A., & Rabinowitz, D. L. 2005, AJ, 635, L97 [Google Scholar]
- Brown, M. E., Barkume, K. M., Ragozzine, D., & Schaller, E. L. 2007, Nature, 446, 294 [NASA ADS] [CrossRef] [PubMed] [Google Scholar]
- Brown, M. E., Schaller, E. L., & Frazer, W. C. 2011, AJ, 739, L60 [Google Scholar]
- Brunetto, R., Barucci, M. A., Dotto, E., & Strazzulla, G. 2006, ApJ, 644, 646 [NASA ADS] [CrossRef] [Google Scholar]
- Choi, Y. J., & Weissman, P. 2006, BAAS, 38, 551 [NASA ADS] [Google Scholar]
- Cooper, J. F., Christian, E. R., Richardson, J. D., & Wang, C. 2003, Earth, Moon, and Planets, 92, 261 [Google Scholar]
- Cruikshank, D. P., Roush, T. L., Bartholomew, M. J., et al. 1998, Icarus, 135, 389 [NASA ADS] [CrossRef] [Google Scholar]
- Dartois, E., Schutte, W., Geballe, T. R., et al. 1999, A&A, 342, L32 [NASA ADS] [Google Scholar]
- de Barros, A. L. F., Domaracka, A., Andrade, D. P. P., et al. 2011, MNRAS, 418, 1363 [NASA ADS] [CrossRef] [Google Scholar]
- D’Hendecourt, L. B., & Allamandola, L. J. 1986, A&AS, 64, 453 [NASA ADS] [Google Scholar]
- Douté, S., Schmitt, B., Quirico, E., et al. 1999, Icarus, 142, 421 [NASA ADS] [CrossRef] [Google Scholar]
- Dumas, C., Terrile, R. J., Brown, R. H., Schneider, G., & Smith, B. A. 2001, AJ, 121, 1163 [NASA ADS] [CrossRef] [Google Scholar]
- Dumas, C., Carry, B., Hestroffer, D., & Merlin, F. 2011, A&A, 528, A105 [NASA ADS] [CrossRef] [EDP Sciences] [Google Scholar]
- Ehrenfreund, P., Kerkhof, O., Schutte, W. A., et al. 1999, A&A, 350, 240 [NASA ADS] [Google Scholar]
- Farnham, T. L. 2001, Icarus, 152, 238 [NASA ADS] [CrossRef] [Google Scholar]
- Ferini, G., Baratta, G. A., & Palumbo, M. E. 2004, A&A, 414, 757 [NASA ADS] [CrossRef] [EDP Sciences] [Google Scholar]
- Fornasier, S., Barucci, M. A., de Bergh, C., et al. 2009, A&A, 508, 457 [NASA ADS] [CrossRef] [EDP Sciences] [Google Scholar]
- Garrod, R. T., & Pauly, T. 2011, ApJ, 735, 15 [NASA ADS] [CrossRef] [Google Scholar]
- Gerakines, P. A., Schutte, W. A., & Ehrenfreund, P. 1996, A&A, 312, 289 [NASA ADS] [Google Scholar]
- Grundy, W. M., & Schmitt, B. 1998, J. Geophys. Res., 103, 25809 [NASA ADS] [CrossRef] [Google Scholar]
- Guilbert, A., Alvarez-Candal, A., Merlin, F., et al. 2009, Icarus, 201, 272 [NASA ADS] [CrossRef] [Google Scholar]
- Hapke, B. 1981, J. Geophys. Res., 86, 4571 [NASA ADS] [Google Scholar]
- Hapke, B. 1986, Icarus, 67, 264 [NASA ADS] [CrossRef] [Google Scholar]
- Hapke, B. 1993, Topics in Remote Sensing (Cambridge, UK: Cambridge University Press) [Google Scholar]
- Hudson, R. L., & Moore, M. H. 1999, Icarus, 140, 451 [NASA ADS] [CrossRef] [MathSciNet] [Google Scholar]
- Hudson, R. L., Palumbo, M. E., Strazzulla, G., et al. 2008, The Solar System Beyond Neptune, 507 [Google Scholar]
- Jewitt, D. C., & Luu, J. 2004, Nature, 432, 731 [NASA ADS] [CrossRef] [PubMed] [Google Scholar]
- Kenyon, S. J., Bromley, B. C., O’Brien, D. P., & Davis, D. R. 2008, The Solar System Beyond Neptune, 293 [Google Scholar]
- Khare, B. N., Sagan, C., Ogino, H., et al. 1986, Icarus, 67, 176 [NASA ADS] [CrossRef] [PubMed] [Google Scholar]
- Khare, B. N., Thompson, W. R., Cheng, L., et al. 1993, Icarus, 103, 290 [NASA ADS] [CrossRef] [Google Scholar]
- Kolokolova, I., Tishkovets, V., & Buratti, B. 2010, Electromagnetic and Light Scattering XII, 98 [Google Scholar]
- Kristensen, L. E., van Dishoeck, E. F., van Kempen, T. A., et al. 2010, A&A, 516, A57 [NASA ADS] [CrossRef] [EDP Sciences] [Google Scholar]
- Licandro, J., Pinilla-Alonso, N., Pedani, M., et al. 2006, A&A, 445, L35 [NASA ADS] [CrossRef] [EDP Sciences] [Google Scholar]
- Lucas, S., Ferry, D., Demirdjian, B., & Suzanne, J. 2005, J. Phys. Chem. B, 109, 18103 [CrossRef] [Google Scholar]
- Mastrapa, R. M. E., & Brown, R. H. 2006, Icarus, 183, 207 [NASA ADS] [CrossRef] [Google Scholar]
- Mate, B., Galvez, O., Herrero, V. J., & Escribano, R. 2009, ApJ, 690, 486 [NASA ADS] [CrossRef] [Google Scholar]
- Merlin, F., Barucci, M. A., de Bergh, C., et al. 2010a, Icarus, 208, 945 [NASA ADS] [CrossRef] [Google Scholar]
- Merlin, F., Barucci, M. A., de Bergh, C., et al. 2010b, Icarus, 210, 930 [NASA ADS] [CrossRef] [Google Scholar]
- Moore, M. H., & Hudson, R. L. 1998, Icarus, 135, 518 [Google Scholar]
- Myszka, J. A., Mastrapa, R. M., & Curry, A. S. 2011, 42nd Lunar and Planetary Science Conference, LPI contribution 1608, 2561 [Google Scholar]
- Ortiz, J. L., Gutiérrez, P. J., Santos-Sanz, P., Casanova, V., & Sota, A. 2006, A&A, 447, 1131 [NASA ADS] [CrossRef] [EDP Sciences] [Google Scholar]
- Pommerol, A., & Schmitt, B. 2008, J. Geophys. Res., 113, E12008 [NASA ADS] [CrossRef] [Google Scholar]
- Quirico, E., & Schmitt, B. 1997, Icarus, 127, 354 [NASA ADS] [CrossRef] [Google Scholar]
- Quirico, E., Doute, S., Schmitt, B., et al. 1999, Icarus, 139, 159 [NASA ADS] [CrossRef] [Google Scholar]
- Schaller, E. L., & Brown, M. E. 2007, ApJ, 659, L61 [NASA ADS] [CrossRef] [Google Scholar]
- Stansberry, J., Grundy, W., Brown, M., et al. 2008, The solar system beyond Neptune (Arizona Press), 161 [Google Scholar]
- Strazzulla, G., Cooper, J. F., Christian, E. R., & Jonhson, R. E. 2003, C.R. Acad. Sci., 4, 791 [Google Scholar]
- Tielens, A. G. G. M., Allamandola, L. J., Bregman, J., et al. 1984, ApJ, 287, 697 [NASA ADS] [CrossRef] [Google Scholar]
- Trujillo, C. A., Sheppard, S. S., & Schaller, E. L. 2011, ApJ, 730, 105 [NASA ADS] [CrossRef] [Google Scholar]
- Wada, A., Mochizuki, N., & Hiraoka, K. 2006, ApJ, 644, 300 [NASA ADS] [CrossRef] [Google Scholar]
- Zubko, V. G., Mennella, V., Colangeli, L., & Bussoletti, E. 1996, The Role of Dust in the Formation of Stars, 333 [Google Scholar]
All Tables
Results (in %) and size (in μm) of the composition and physical parameters obtained with the Hapke model (see text for details).
All Figures
|
Fig. 1 Spectra of (5145) Pholus from 0.4 to 2.3 microns. We adopted the reflectance values determined by Cruikshank et al. (1998) to adjust the different parts of the spectrum. All spectra have been normalized at 0.55 μm and are shifted along the y-axis for clarity. |
| In the text | |
|
Fig. 2 Spectra of (5145) Pholus in the nIR and their differences (represented in the lower part as a continuous line with superimposed linear fit). The spectrum of 2008 (this work) is represented as a continuous line and that of Cruikshank et al. (1998) is represented as a dotted line. |
| In the text | |
|
Fig. 3 Spectra of the three objects and the results of our spectral modeling. The fits are represented by continuous and dotted lines. The continuous lines show the wavelength ranges at which the models have been adjusted with the observations while the dotted lines follow the models outside these ranges. Except for 2004 TY364, all spectra and models have been shifted along the y-axis for clarity. |
| In the text | |
|
Fig. 4 Absorbance of pure methanol ice and almost pure water ice at 35 K in both states (amorphous phase as a continuous line and crystalline phase as a dotted line). Methanol contamination is expected to be lower than 6 − 7% for the almost pure water ice. |
| In the text | |
|
Fig. 5 Absorbance of pure and mixed ices between 2750 and 3400 cm-1 at 55 K for 1 micron thickness layers. On the left: amorphous phase of pure CH3OH (black), almost pure H2O (blue) and mixtures of both with CH3OH:H2O mixing ratio of 20:80 (red) and 48:52 (dash-point). On the right: ices are in crystalline phase and the same legend is used. The synthetic spectrum of a 48:52 mixing ratio obtained from pure methanol and water ices is plotted as a dotted line. (The color version is available in the electronic version.) |
| In the text | |
|
Fig. 6 Band peak position depending on the temperature for three vibration modes (or combination) and different dilution state. Top left: frequency of the absorption band associated to the CH3OH torsion or the H2O libration or a blend of both. Top right: frequency of the CO stretch vibration mode, only reported for a CH3OH:H2O mixing ratio with CH3OH greater than 40%. Bottom left: frequency of the absorption band associated to the OH-stretch. |
| In the text | |
|
Fig. 7 Dilution effects between 2500 and 3200 cm-1 at 55K for a 1 micron thickness layer. Absorbance spectra were normalized for two cases. The first spectrum was obtained with almost pure CH3OH (continuous black line) and the second one using a mixture of CH3OH:H2O (mixing ratio close to 50:50 presented as a dash-point line). Both ices are in amorphous phase. |
| In the text | |
Current usage metrics show cumulative count of Article Views (full-text article views including HTML views, PDF and ePub downloads, according to the available data) and Abstracts Views on Vision4Press platform.
Data correspond to usage on the plateform after 2015. The current usage metrics is available 48-96 hours after online publication and is updated daily on week days.
Initial download of the metrics may take a while.