Free Access
Fig. 8
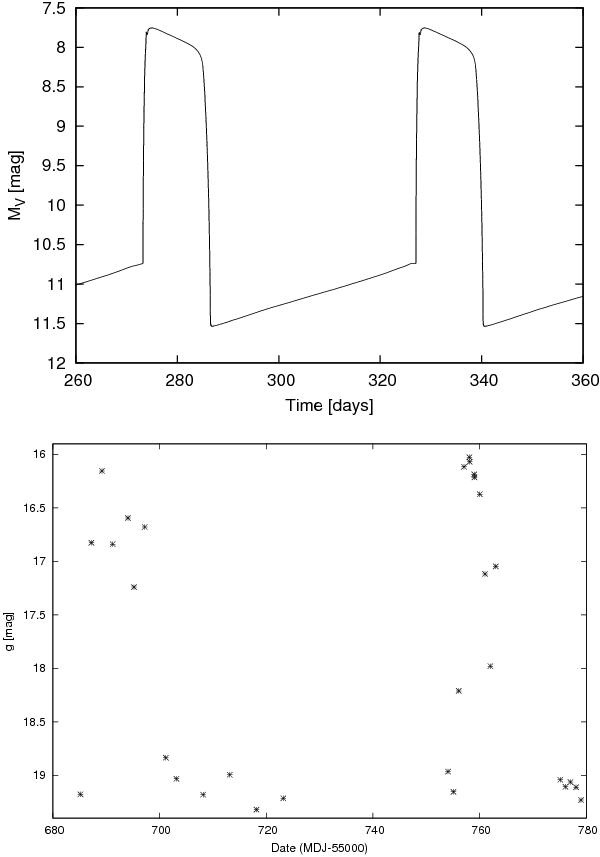
Top: KL Dra model: αc = 0.035, αh = 0.2, Ṁtr = 2 × 10¹⁶ g/s, M1 = 0.6, γ = 0.8, ⟨ RD ⟩ = 1.2 × 1010 cm, μ30 = 1. Bottom: the part of KL Dra light curve showing two subsequent superoutbursts. The time between their maxima is 60 days, their amplitude is 3 mag and their duration is ~13 days. Data provided by G. Ramsay.
This figure is made of several images, please see below:
Current usage metrics show cumulative count of Article Views (full-text article views including HTML views, PDF and ePub downloads, according to the available data) and Abstracts Views on Vision4Press platform.
Data correspond to usage on the plateform after 2015. The current usage metrics is available 48-96 hours after online publication and is updated daily on week days.
Initial download of the metrics may take a while.