Fig. 3
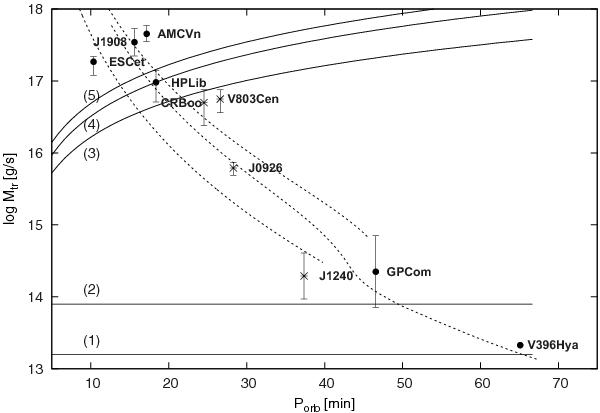
The log Ṁtr – Porb plane. Dots – persistent AM CVn systems with known distances; asterisks – outbursting AM CVn systems with known distances; solid lines – the upper and lower critical limits Ṁtr: (1)  for M1 = 1.0, Y = 1.0; (2) for M1 = 0.6, Y = 1.0; (3)
  for M1 = 1.0, Y = 0.96,Z = 0.04; (4) for M1 = 1.0, Y = 1.0; (5) for M1 = 0.6, Y = 1.0. (M1 – in solar units). Dotted lines: evolution models for AM CVns through the WD channel (kindly provided by Chris Deloye).
Current usage metrics show cumulative count of Article Views (full-text article views including HTML views, PDF and ePub downloads, according to the available data) and Abstracts Views on Vision4Press platform.
Data correspond to usage on the plateform after 2015. The current usage metrics is available 48-96 hours after online publication and is updated daily on week days.
Initial download of the metrics may take a while.