Fig. 7
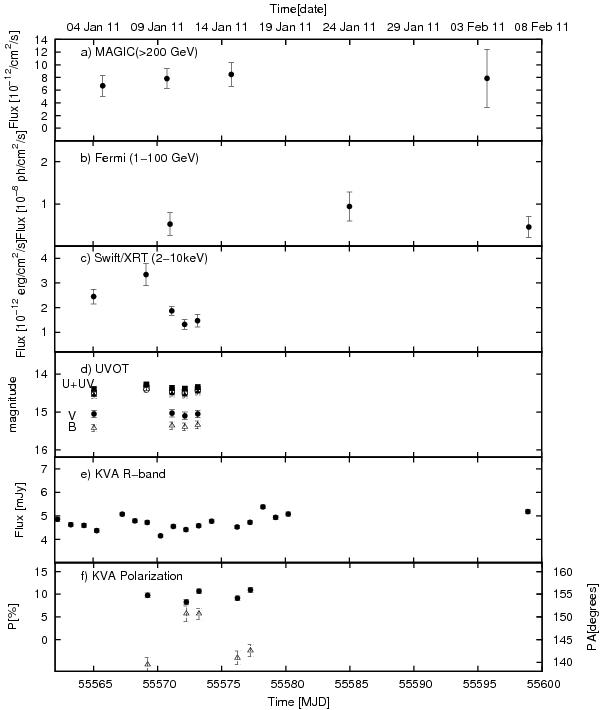
Multi-wavelength light curve of 1ES 1215+303 from 2011 January to February. a) In the MAGIC light curve, the data are binned in 5-day intervals. b) The Fermi-LAT light curve (1 − 100 GeV) has bins of 14 days. c) Swift/XRT light curve. d) UVOT optical and UV light curves. e) The R-band light curve shows hourly average fluxes of the source, the error bars are smaller than the symbols in most cases. f) The optical polarization (filled circles, left axis) and polarization position angle (triangles, right axis) are hourly averages.
Current usage metrics show cumulative count of Article Views (full-text article views including HTML views, PDF and ePub downloads, according to the available data) and Abstracts Views on Vision4Press platform.
Data correspond to usage on the plateform after 2015. The current usage metrics is available 48-96 hours after online publication and is updated daily on week days.
Initial download of the metrics may take a while.