Fig. 1
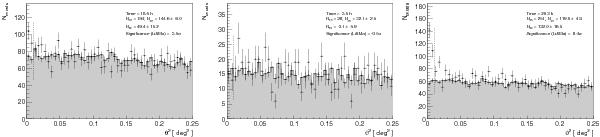
Distributions of the θ2 parameter for 1ES 1215+303 signal (black histograms) and background estimation (gray histograms) for the three observation periods: January − February 2010 (left), May − June 2010 (middle), and January − February 2011 (right). The vertical dashed line corresponds to the apriori defined signal region θ2 < 0.01 deg2.
Current usage metrics show cumulative count of Article Views (full-text article views including HTML views, PDF and ePub downloads, according to the available data) and Abstracts Views on Vision4Press platform.
Data correspond to usage on the plateform after 2015. The current usage metrics is available 48-96 hours after online publication and is updated daily on week days.
Initial download of the metrics may take a while.