Fig. 4
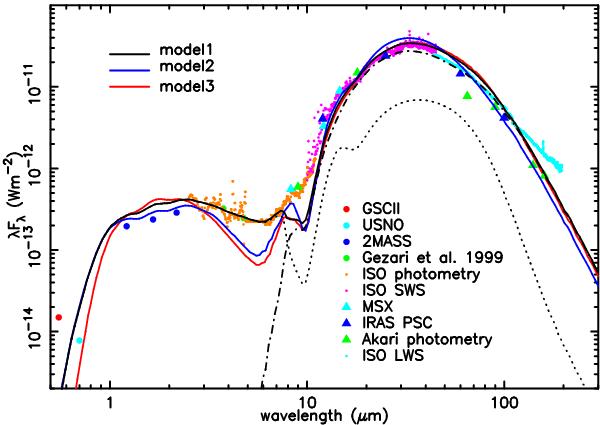
Comparison of SEDs. Black lines are the result of the model with an inner disk. The solid, dotted, and dash-dot lines denote the total flux, the scattered light, and the thermal emission, respectively. Red and blue lines denote the results of the same geometry form but the disk mass of 0 and a model with only a torus with an inner radius of 500 AU. Colored dots are collected from previous observations: US Naval Observatory (USNO), the HST Guide Star Catalog (GSC)-II, 2MASS all-sky catalog of point source, Catalog of Infrared Observations, Edition 5 (Gezari et al. 1999), ISO photometry, SWS and LWS, MSX infrared point source catalog, IRAS point source catalog, and Akari/IRC mid-IR all-sky Survey (Ishihara et al. 2010).
Current usage metrics show cumulative count of Article Views (full-text article views including HTML views, PDF and ePub downloads, according to the available data) and Abstracts Views on Vision4Press platform.
Data correspond to usage on the plateform after 2015. The current usage metrics is available 48-96 hours after online publication and is updated daily on week days.
Initial download of the metrics may take a while.