Free Access
Fig. 2
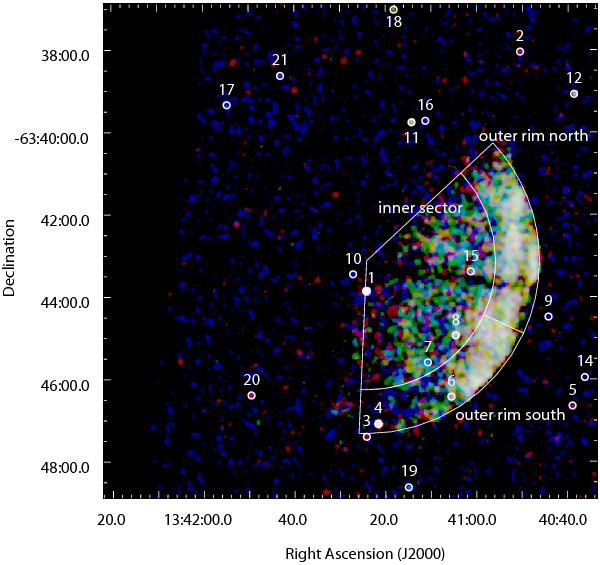
Chandra ACIS-I color image of G308.4–1.4 (red 0.1–1.0 keV, green 1–1.5 keV and blue 1.5–5 keV). The images are binned with 1′′ per pixel and smoothed by a Gaussian kernel of σ = 3′′. 20 point sources were detected in the 12′ × 12′ area around the center of G308.4–1.4 (cf. Table 1).
Current usage metrics show cumulative count of Article Views (full-text article views including HTML views, PDF and ePub downloads, according to the available data) and Abstracts Views on Vision4Press platform.
Data correspond to usage on the plateform after 2015. The current usage metrics is available 48-96 hours after online publication and is updated daily on week days.
Initial download of the metrics may take a while.