Fig. 3
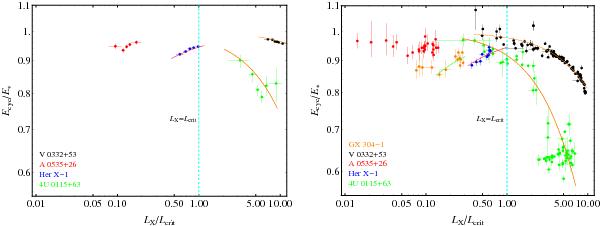
Same as Fig. 2 except with the x-axis rescaled as LX/Lcrit and the y-axis rescaled as Ecyc/E∗. The values of E∗ and Lcrit used for each source are listed in Table 2. The solid curves associated with each group of data represent the theoretical predictions for the variation of the CRSF energy Ecyc as a function of LX for each source, computed using Eq. (58), with the emission height h evaluated using Eq. (40) for the supercritical sources and Eq. (51) for the subcritical sources.
Current usage metrics show cumulative count of Article Views (full-text article views including HTML views, PDF and ePub downloads, according to the available data) and Abstracts Views on Vision4Press platform.
Data correspond to usage on the plateform after 2015. The current usage metrics is available 48-96 hours after online publication and is updated daily on week days.
Initial download of the metrics may take a while.