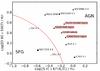
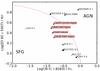
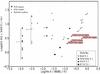
Fig. 8

Diagnostic line-ratio diagrams for different regions in the CAL 83 nebula compared with ultra-luminous X-ray sources (ULX), which have much harder X-ray spectra, as well as star forming galaxies (SFG) and AGNe. ULX data were taken from Abolmasov et al. (2007, 2008). The name for each ULX is given next to the symbols. The positions of different parts of the CAL 83 nebula are given by filled upright triangles. Solid curves represent the theoretical “maximum starburst” line from Kewley et al. (2001) which distinguishes AGNe from H II region-like objects (such as SFG).Left: [OIII] λ5007/Hβ vs. [SII] λλ6716,6731/Hα.Right: [OIII] λ5007/Hβ vs. [NII] λ6583/Hα.Bottom: [OIII] λ5007/Hβ vs. He II λ4686/Hβ. The filled dots here correspond to our cloudy models for SXSs. The numbers near the filled circles indicate the model number from Table 5. For comparison we have included starburst galaxies and H II regions, the data for these objects being taken from the same paper as the SXS models. Arrows represent upper limits; vertical bars with horizontal arrows drawn adjacent to certain starburst galaxies and H II regions indicate common sets of upper limits.
Current usage metrics show cumulative count of Article Views (full-text article views including HTML views, PDF and ePub downloads, according to the available data) and Abstracts Views on Vision4Press platform.
Data correspond to usage on the plateform after 2015. The current usage metrics is available 48-96 hours after online publication and is updated daily on week days.
Initial download of the metrics may take a while.