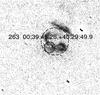
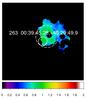
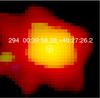
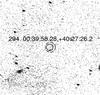
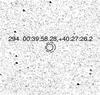
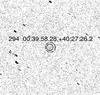
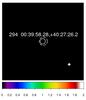
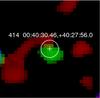
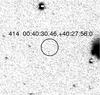
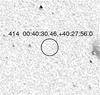
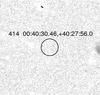
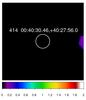
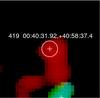
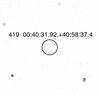
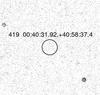
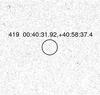
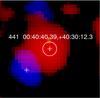
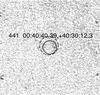
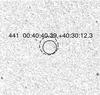
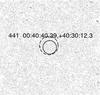
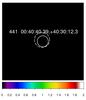
Fig. A.1
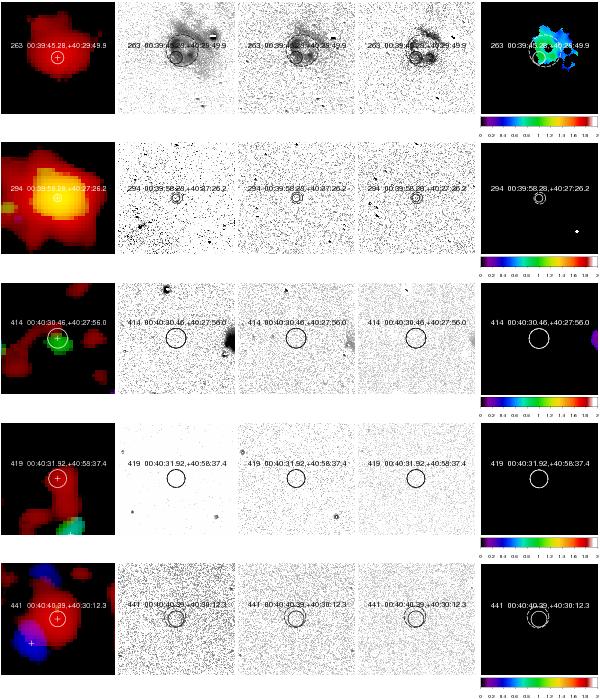
XMM-Newton three-colour image (red 0.2–1.0 keV, green 1.0–2.0 keV, blue 2.0–4.5 keV), continuum-subtracted LGGS Hα, [S ii], and [O iii] images, and an [S ii]/Hα ratio image with XMM-Newton 3σ positional error circle (solid). The dashed circle shows the extraction region for the optical emission. If no dashed circle is shown, the X-ray error circle was used. The shown area has a size of ~1′ × 1′. The label gives the source number of the XMM-Newton catalogue (SPH11), followed by the coordinates. The positions of all detected XMM-Newton sources are marked in the XMM-Newton images (left) with crosses.

Current usage metrics show cumulative count of Article Views (full-text article views including HTML views, PDF and ePub downloads, according to the available data) and Abstracts Views on Vision4Press platform.
Data correspond to usage on the plateform after 2015. The current usage metrics is available 48-96 hours after online publication and is updated daily on week days.
Initial download of the metrics may take a while.