Fig. 7
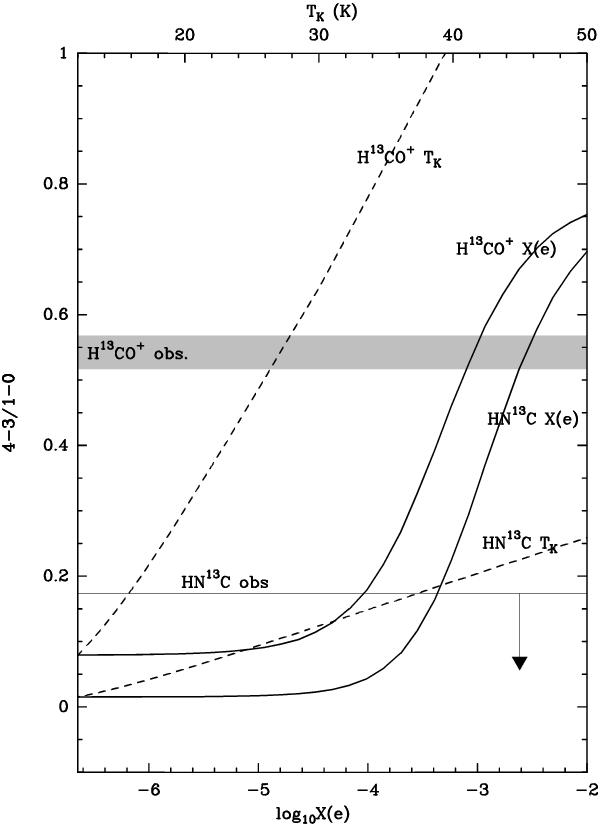
Plot showing the effect of increasing electron fractional abundance (thick black curves, calculated using a constant kinetic temperature of 12 K) and kinetic temperature (dashed curves, calculated using a negligible electron abundance) on the 4 → 3/1 → 0 line intensity ratios of H13CO+ and HN13C, for gas with an H2 density of 6 × 105 cm-3 and H13CO+ and HN13C column densities of 8.8 × 1011 cm-2 and 5.1 × 1011 cm-2 respectively. The grey bar shows the observed H13CO+ 4 → 3/1 → 0 line intensity ratio towards NGC 1333, taking into account the 1σ errors in the observations. The thin black line shows the upper limit to the observed HN13C 4 → 3/1 → 0 line intensity ratio towards NGC 1333.
Current usage metrics show cumulative count of Article Views (full-text article views including HTML views, PDF and ePub downloads, according to the available data) and Abstracts Views on Vision4Press platform.
Data correspond to usage on the plateform after 2015. The current usage metrics is available 48-96 hours after online publication and is updated daily on week days.
Initial download of the metrics may take a while.