Fig. 6
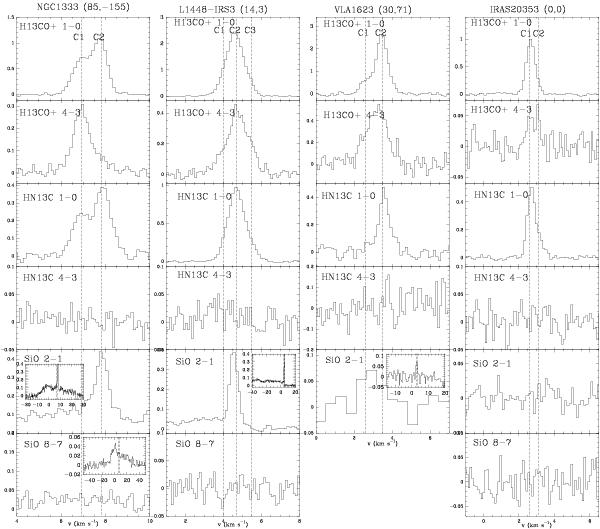
Spectra of the J = 1 → 0 and 4 → 3 lines of
H13CO+ and HN13C, and the
J = 2 → 1 and 8 → 7 lines of SiO towards the sources NGC 1333,
L1448-IRS3, VLA 1623 and IRAS 20353, for the positions selected in Sect. 4 (given at the top of each column). To account for
the different beam sizes, the spectra have been averaged by assuming a Gaussian taper,
whose FWHM corresponds to the largest beam size of the observations
(~29′′). The vertical axis is line intensity in Kelvin on the
 scale.
The spectra have been smoothed to a velocity resolution of ~0.1 km s-1,
apart from SiO 2 → 1 towards VLA 1623, which has been smoothed
to ~0.5 km s-1 in order to see the line more clearly. The insets where
plotted show the full width of the spectrum.
scale.
The spectra have been smoothed to a velocity resolution of ~0.1 km s-1,
apart from SiO 2 → 1 towards VLA 1623, which has been smoothed
to ~0.5 km s-1 in order to see the line more clearly. The insets where
plotted show the full width of the spectrum.
Current usage metrics show cumulative count of Article Views (full-text article views including HTML views, PDF and ePub downloads, according to the available data) and Abstracts Views on Vision4Press platform.
Data correspond to usage on the plateform after 2015. The current usage metrics is available 48-96 hours after online publication and is updated daily on week days.
Initial download of the metrics may take a while.