Fig. 5
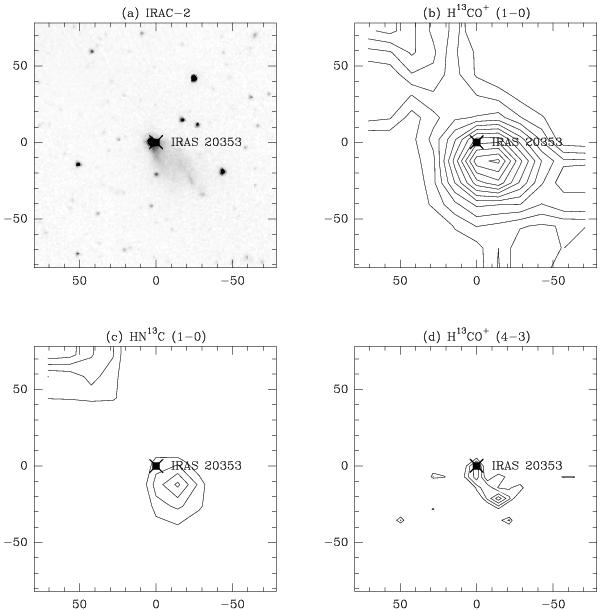
As in Fig. 2, but for IRAS 20353. For this source no SiO 2 → 1 was detected, and the H13CO+ 4 → 3/1 → 0 integrated intensity ratio map did not contain a sufficient number of valid pixels, therefore these maps are not shown. For maps b) to d) (showing the integrated intensities of only H13CO+ 1 → 0, HN13C 1 → 0 and H13CO+ 4 → 3), the values of σ (and contour step) in K km s-1 are: b) 0.034 (0.074), c) 0.067 (0.067), and d) 0.021 (0.014). Here the first contour level of H13CO+ 4 → 3 (map d)) is 3σ, as opposed to 5σ used in all the previous maps.
Current usage metrics show cumulative count of Article Views (full-text article views including HTML views, PDF and ePub downloads, according to the available data) and Abstracts Views on Vision4Press platform.
Data correspond to usage on the plateform after 2015. The current usage metrics is available 48-96 hours after online publication and is updated daily on week days.
Initial download of the metrics may take a while.