Fig. 2
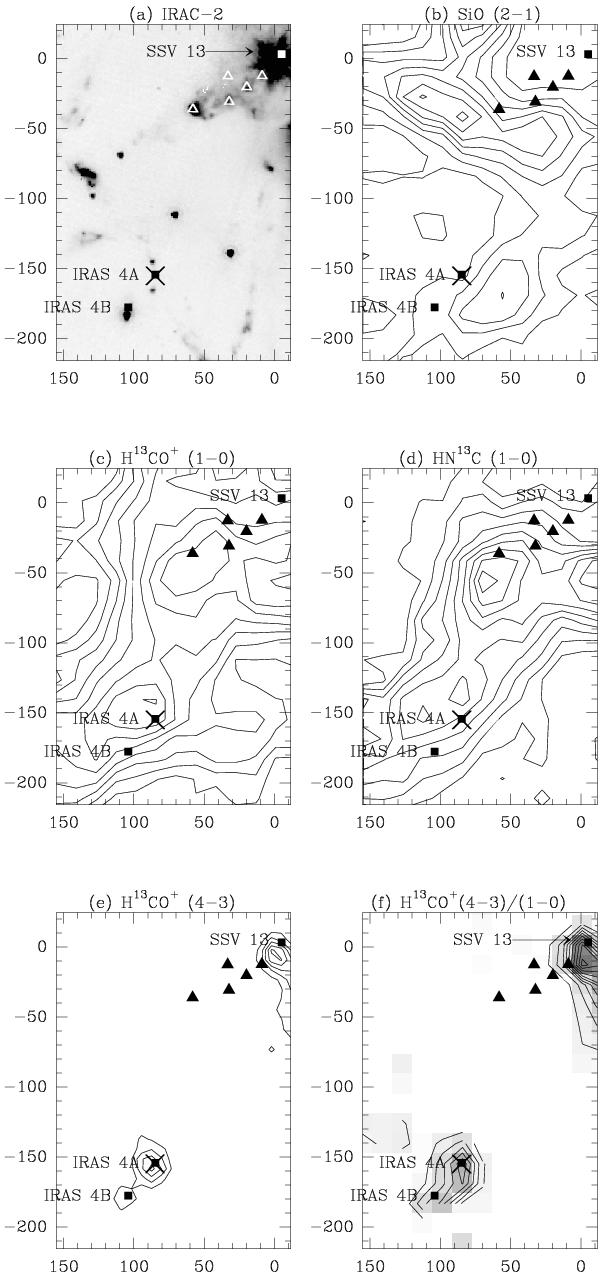
Maps of the NGC 1333 region. Offsets are relative to the positions given in Sect. 3. a) Shows the Spitzer IRAC channel 2 emission (4.5 μm, retrieved from the Spitzer archive), and b) to e) show the integrated intensity maps of SiO 2 → 1, H13CO+ 1 → 0, HN13C 1 → 0, and H13CO+ 4 → 3. For maps b) to e) the contour levels start at 5σ, where σ is the estimated rms noise towards the centre of the map (it is higher towards the map edges). The values of σ (and contour step) in K km s-1 for these maps are: b) 0.044 (0.22), c) 0.094 (0.18), d) 0.056 (0.10), and e) 0.052 (0.26). Map f) shows the H13CO+ 4 → 3/1 → 0 integrated intensity ratio, with a lowest contour level of 0.1 and step 0.05. The grey-scale image is shown to make the map easier to read. The squares show the location of nearby protostars and the triangles show the Herbig-Haro 7–11 objects. The cross shows the location where we have extracted the single spectra.
Current usage metrics show cumulative count of Article Views (full-text article views including HTML views, PDF and ePub downloads, according to the available data) and Abstracts Views on Vision4Press platform.
Data correspond to usage on the plateform after 2015. The current usage metrics is available 48-96 hours after online publication and is updated daily on week days.
Initial download of the metrics may take a while.