Fig. 5
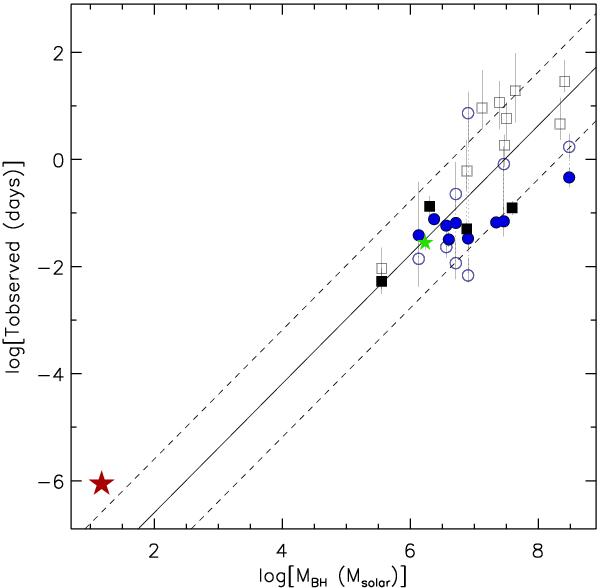
Observed bend timescale versus the BH mass. The continuous line is the best-fitting following Eq. (4). The dashed lines illustrate the ± 1 dex region around this model. Circles represent NLSy1s, squares represent Type-1 Seyferts, and the small green star is the Type-2 Seyfert. The open symbols are data-points reported in the literature and filled symbols are the data-points reported here. The Cygnus X-1 data are shown as a red big star. A dotted line is used to link multiple frequency bends for the same object.
Current usage metrics show cumulative count of Article Views (full-text article views including HTML views, PDF and ePub downloads, according to the available data) and Abstracts Views on Vision4Press platform.
Data correspond to usage on the plateform after 2015. The current usage metrics is available 48-96 hours after online publication and is updated daily on week days.
Initial download of the metrics may take a while.