Fig. 2
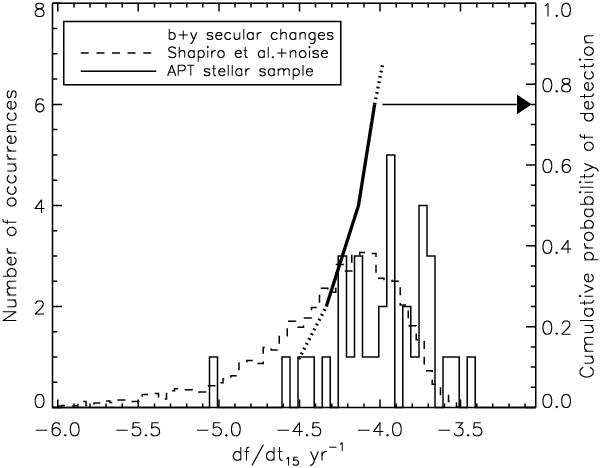
A histogram of stellar secular behavior as measured by the fractional rate of change of b + y photometric flux with time,  , for a sample of 34 stars observed with Automated Photoelectric Telescopes. The subscript “15” means that
  was derived from a time series of 15 years duration. Also shown are commensurate histograms from the time series of the reconstruction of Shapiro and colleagues, computed as described in the text. The sloped line near x = −4.2 shows the probability that the given value of will be detected in the stellar sample, evaluated using the statistical properties of the photometric standard stars used.
Current usage metrics show cumulative count of Article Views (full-text article views including HTML views, PDF and ePub downloads, according to the available data) and Abstracts Views on Vision4Press platform.
Data correspond to usage on the plateform after 2015. The current usage metrics is available 48-96 hours after online publication and is updated daily on week days.
Initial download of the metrics may take a while.