Fig. 1
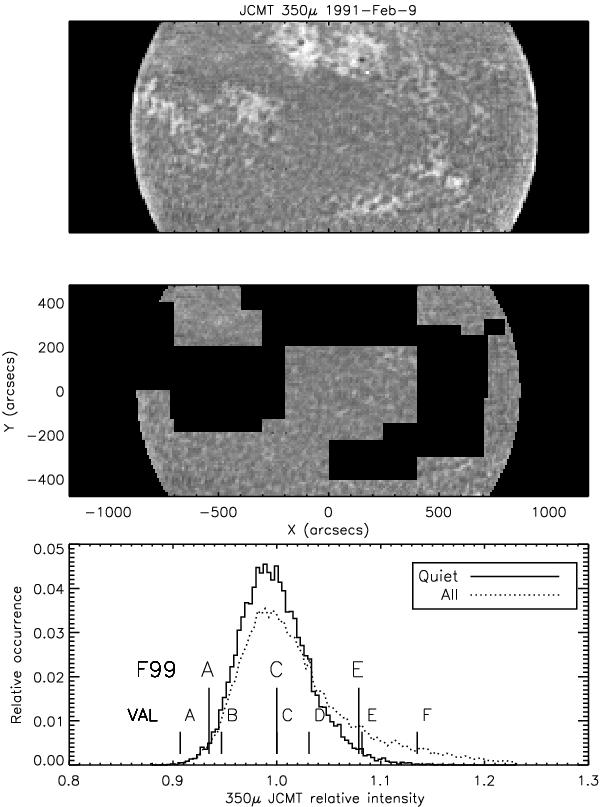
Intensity data at 350μ from the James Clerk Maxwell telescope obtained by Lindsey et al. (1995). The upper figure shows, on a linear scale, part of the solar disk scanned by the JCMT on 1991 Feb. 9. The middle panel shows the same data without limb brightened regions and active regions, identified by eye. The lowest panel shows the distribution functions of relative intensities for both images (not counting zeros), and the locations of the model brightnesses at this wavelength (with model C set to unity), for both the F99 and VAL models. The intensities are linearly proportional to the temperature between 450 and 550 km above the visible continuum of the Sun.
Current usage metrics show cumulative count of Article Views (full-text article views including HTML views, PDF and ePub downloads, according to the available data) and Abstracts Views on Vision4Press platform.
Data correspond to usage on the plateform after 2015. The current usage metrics is available 48-96 hours after online publication and is updated daily on week days.
Initial download of the metrics may take a while.